
Urban Heat Island Effect
February 2023 - October 2024
This use case provided high-resolution urban heat maps for cities across Europe to underpin and motivate urban climate adaptation measures that are being developed.
This use case ran from February 2023 – October 2024 and is now closed.
Challenge
In recent years, climate change has been causing increasingly frequent and intense heatwaves in Europe. Climate projections indicate that the population exposure to extreme heat will rise by more than an order of magnitude towards the end of the century. Cities are especially at risk because of the urban heat island (UHI) phenomenon, which causes a much higher exposure to heat stress for citizens compared to rural areas.

Use Case Overview
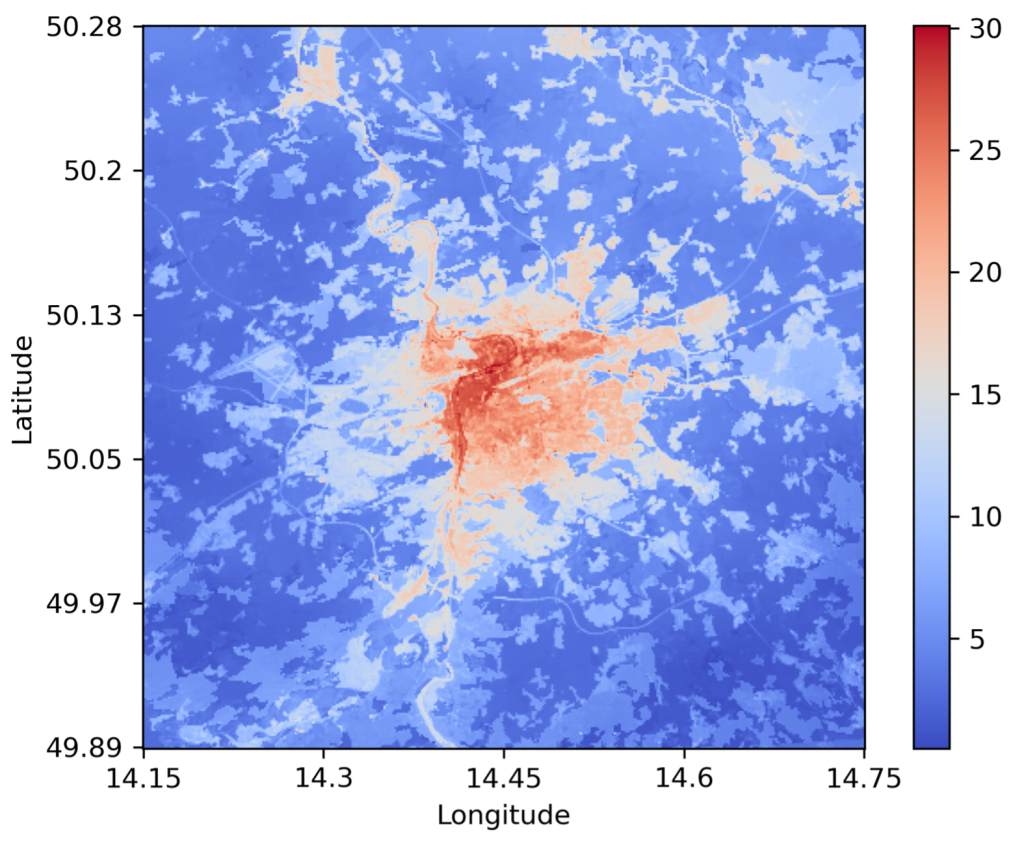
In this context, this use case provides high-resolution urban heat maps for cities across Europe to underpin and motivate urban climate adaptation measures that are being developed. The urban heat maps are generated by means of a physics-based high resolution urban climate model, UrbClim, nested within large-scale atmospheric output provided by state-of-the-art global climate models in the DestinE Digital Twin platform. UrbClim downscales the global climate model results for selected urban areas based on detailed terrain data, providing air temperature and thermal comfort indicators at a spatial resolution of 100m.
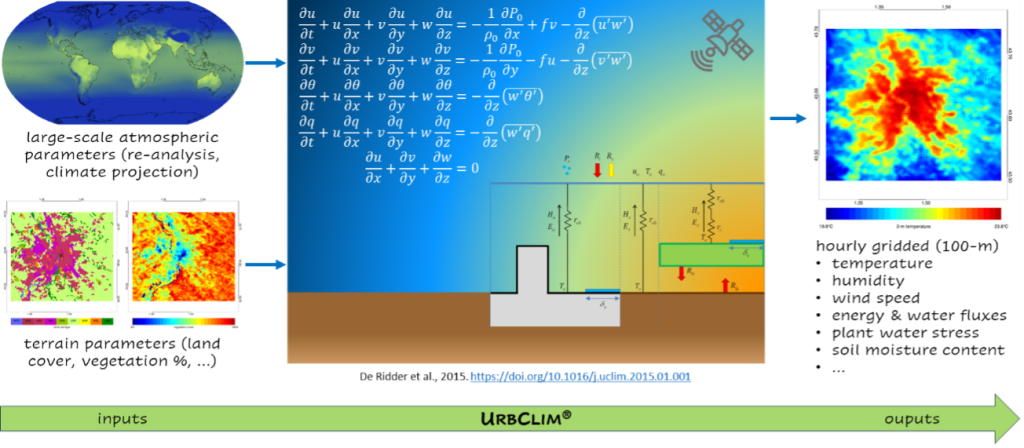
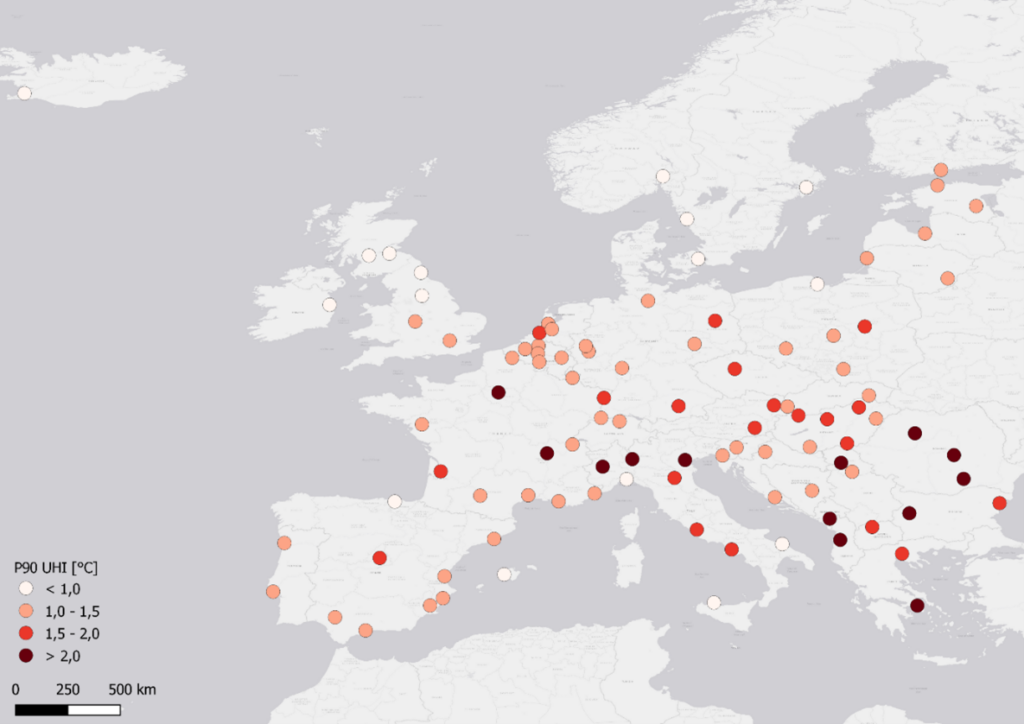
The UrbClim model has been applied before in a pan-European context, providing detailed urban climate data for a 10-year historical period for 100 cities in Europe, in the framework of the Copernicus Health contract for the C3S data platform. The data have also been used to work out an Urban Heat Island indicator for the European Environmental Agency’s Urban Adaptation Map viewer. These results have been validated with 67 meteorological measurement stations across Europe, yielding excellent error statistics.
For the service developed in this project, it is possible to launch the model from an API request, invoking automatic model calculations on DestinE’s core services platform. In the API, the model domain is specified as well as the number of historical years to be modelled, future climate projection data to be used and the output indicator to be calculated. The urban data and maps are made available to the user through an interactive interface, including selection, viewing, analysing and download capabilities.

In the first phase of the project, a broad stakeholder community was gathered around the topic of urban heat stress. Three main users of the service were identified: DG REGIO, the City of Prague and the Lisbon Metropolitan Area. Besides these three main users, a long list of additional stakeholders are involved in the service. Through telco’s and a dedicated hybrid user exchange workshop in Brussels, user needs and requirements were collected, which provided input to shape the outline of the use case.

Urban Heat use case ‘core team’, participating in the User Exchange Workshop: Jörn Hoffman (ECMWF, contract provider); delegation of VITO (Filip Lefebre & Dirk Lauwaet, contractor); Joachim Maes (DG REGIO, core user); Maria Kazmuková (City of Prague, representative of demo city). Excused: João Lopes and Frederico Metelo (Lisbon Metropolitan Area, representatives of demo city).
The Urban Heat service is compiled in a way that computation of the following output data is possible:
- Heat stress calculations are performed for both a recent past period (2011-2020) and future climate projections (2020-2040/2050).
- The climate projections from DT Climate are compared to IPCC CMIP6 global climate model results.
- Three advanced heat stress variables (the Wet Bulb Globe Temperature (WBGT), the Universal Thermal Climate Index (UTCI) and the Apparent Temperature), that take temperature, humidity, wind speed and radiation into account, are calculated.
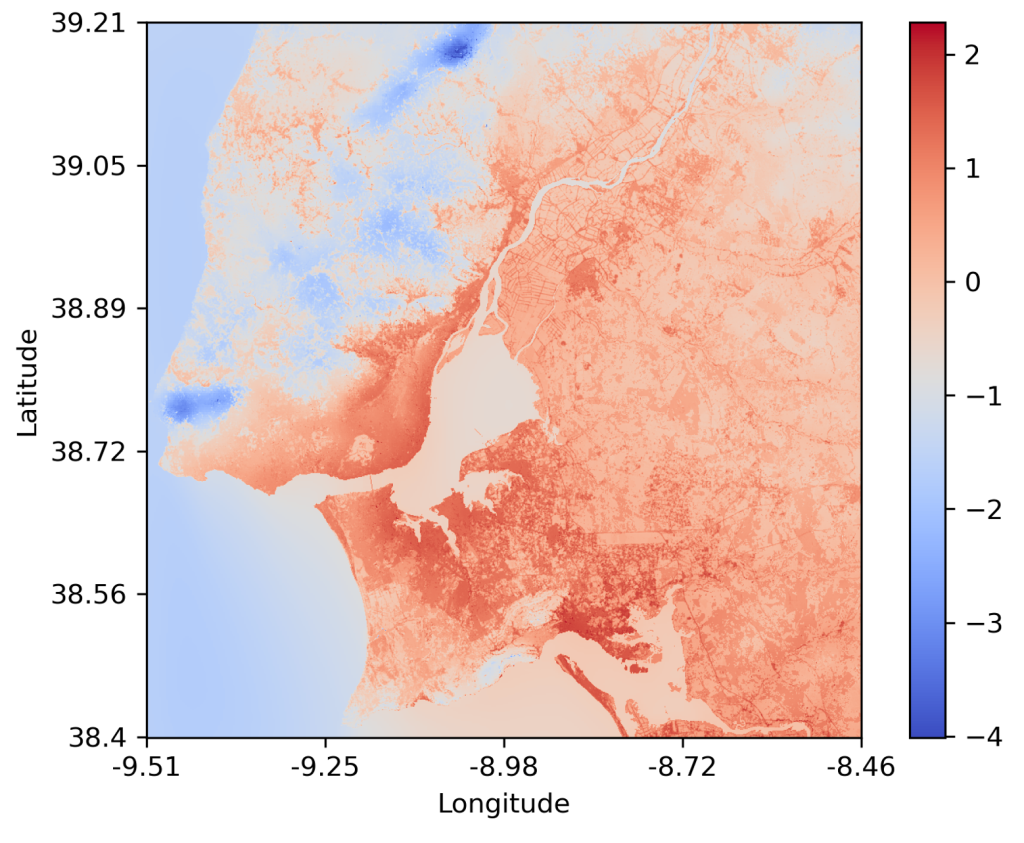
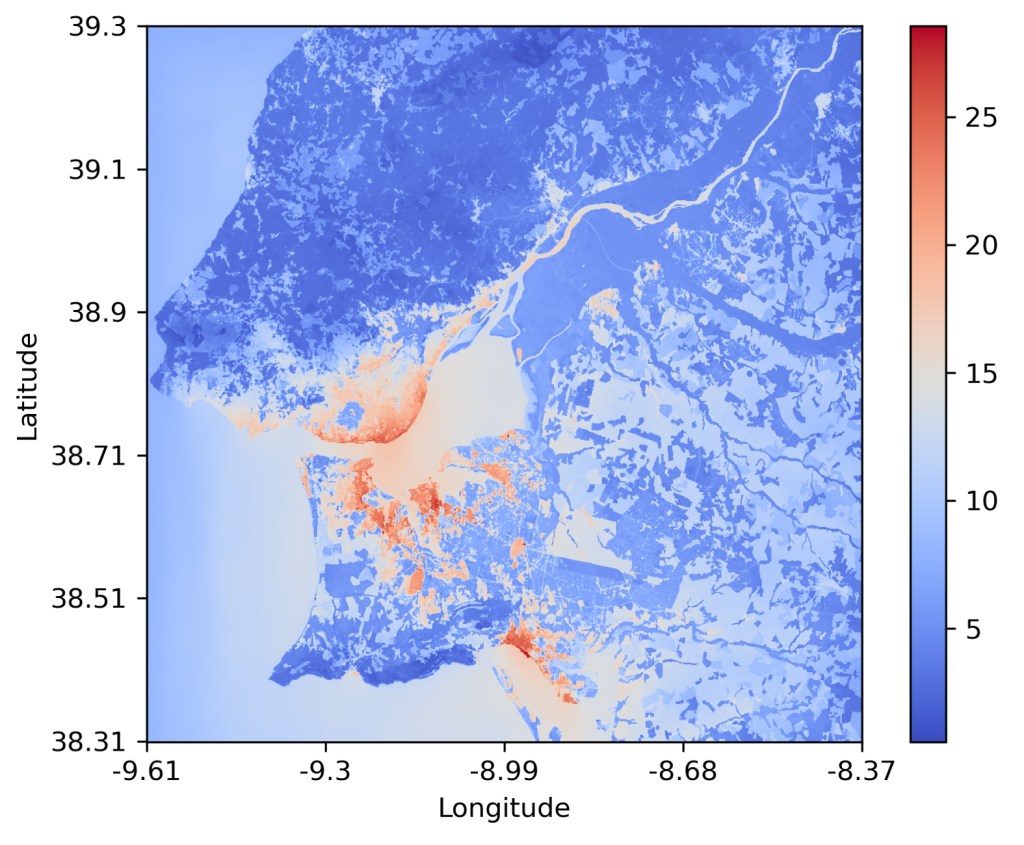
- The calculations are performed with a horizontal resolution of 100m and cover the entire metropolitan areas of Prague and Lisbon.
- Both raw hourly output data as well as decadal overview maps are provided.
- The following output indicators are provided: Urban Heat Island (UHI) intensity, number of heatwave days, exposure of the population to heatwaves, heat-related mortality, exceedances of health threshold levels, lost working hours and cool island identification.
Furthermore, the potential of the service to assess the impact of climate adaptation measures (e.g. land cover changes, urban trees, soil unsealing,…) are demonstrated for the two demonstration cities. As this is a manual and context specific process, this aspect is not included in the automatic operational service.
Important to note is that the service, demonstrated for 2 specific cities, is implemented in a way that can be easily replicated for any urban area in Europe in a potential follow-up project.

Potential urban heat stress adaptation measures. Source: Google images.
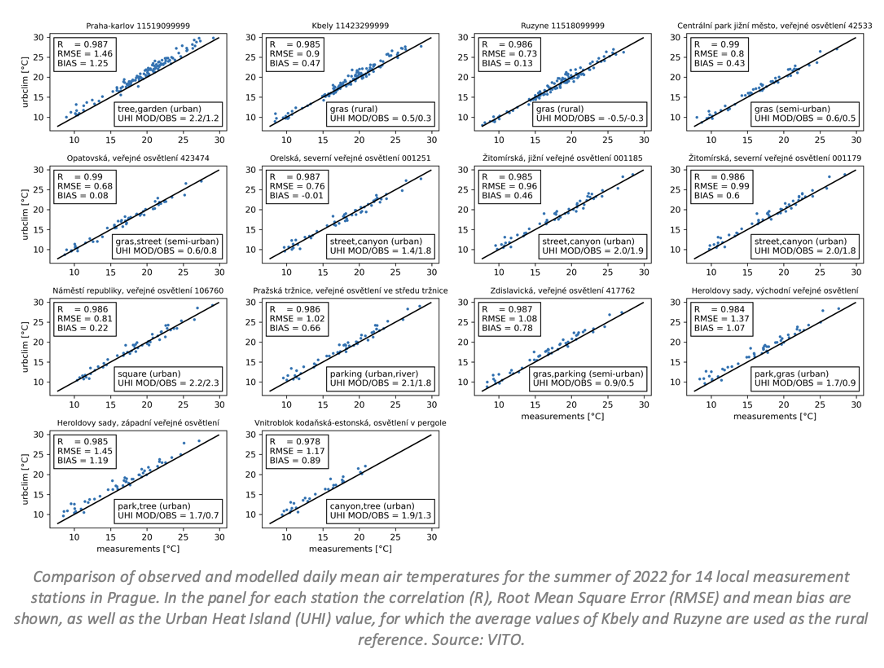
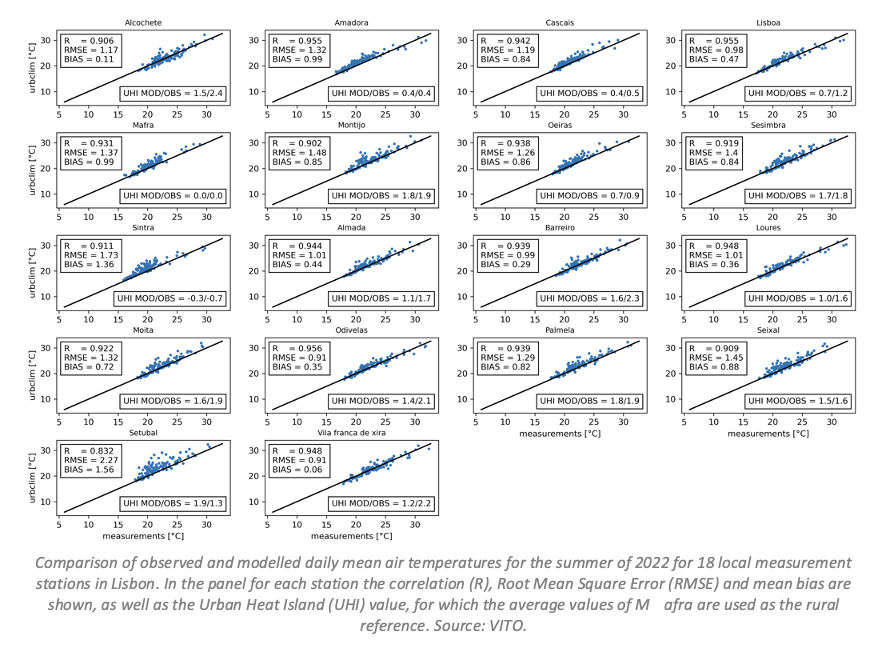
The second phase of the project has been started and the UrbClim model was set up for the two demonstration cities of Prague and Lisbon, performing model simulations for the reference period (2011-2020), based on ERA5 reanalysis data. Postprocessing scripts have been written to calculate the agreed upon urban heat indicators. First output maps were produced and discussed with the demonstration cities.
Furthermore, a validation exercise was performed, using existing networks of local measurement stations that were available in both demonstration cities. The UrbClim results were compared to daily mean temperatures and daily maximum apparent temperatures from measurements for the summer of 2022. The model was capable of reproducing observed values with small biases and good error statistics, certainly giving the fact that most of these stations were in non-optimal measurement locations and used non-professional equipment (e.g. no automatic ventilation). So the model results are found to correctly represent the local air temperature and humidity conditions in both demonstration cities.
Finally, the impact of 5 ambitious climate adaptation scenarios has been calculated, to assess the maximal effect you can obtain with these types of measures and compare between them. These measures are focused on the urban areas in the region and applied everywhere, as previous results have shown that only the wide-spread application of measures is effective to reduce the overall urban heat stress.
Climate adaptation scenarios:
- Green roofs: all the roofs in the Lisbon Metropolitan Area are converted to intensive green roofs
- Light-colored materials: the albedo of all build-up areas is changed to 0.3 (realistic white)
- Soil unsealing: 50% of all non-building urban areas are unsealed
- Urban trees: 50% of all non-building urban areas are under tree crown cover
- Combination of all of these: maximum impact scenario
The tables below show an overview of the average values of the indicators for the urban areas of the Lisbon Metropolitan Area and the city of Prague.
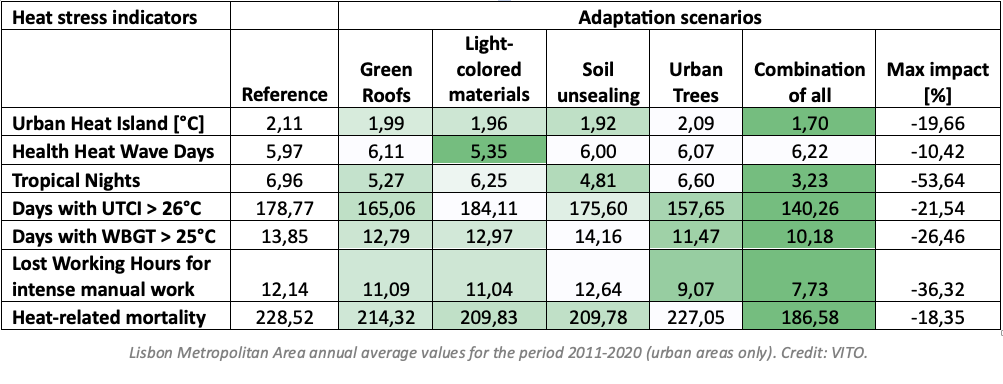
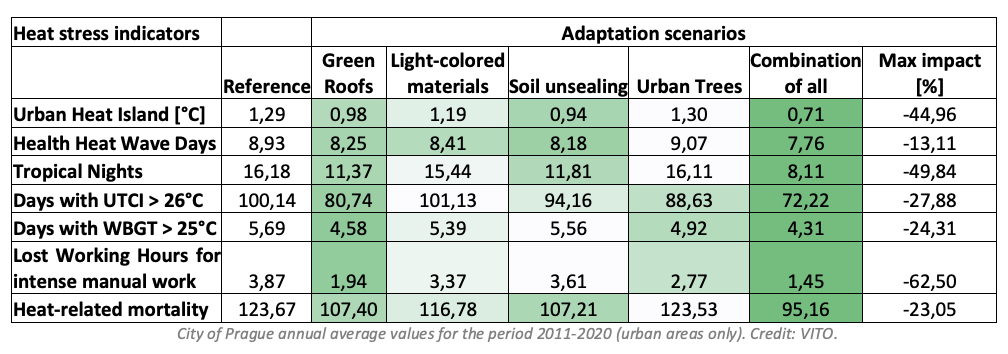
The adaptation measures have a significant positive effect on the heat stress indicators and the combination of all these measures is always the most impactful way of reducing the heat stress indicators. Not all heat stress problems are solved when applying these adaptation measures, but the indicator values are significantly reduced and almost comparable to the values for rural areas.
Next steps
We are developing a web portal where the indicator maps can be visualized and downloaded. In the coming months, climate projection simulations will be performed, based on the results from Destine Earth’s high-resolution global climate models. We will investigate the impact of climate change on the heat stress indicators, and how this compares to the cooling effects of the adaptation measures.
The users and contractor will jointly demonstrate the concrete use of the urban data, maps and user interface. As part of this joint exercise, a performance assessment will be made, considering both the scientific uncertainty of the data and their fitness-for-purpose.