Disaster Risk Mitigation & Climate Adaptation
February 2023 - October 2024
This DestinE Use Case provided an opportunity to obtain higher-resolution meteorological forecasts and climate projections contributing towards keeping people safe from flooding, now and for the future.
This use case ran from February 2023 – October 2024 and is now closed.
In a nutshell
- Compound flooding can have devastating impacts in densely populated and build-up delta areas. The co-occurrence of high tides, surge, wave runup, river discharge extremes and precipitation often results in more extreme events than experienced for each of the single flood drivers. This is especially the case for cyclones.
- Deltares, together with its partners KNMI, Tecnalia and 510 Red Cross, developed a digital twin that supports disaster risk reduction and climate adaptation to reduce the impacts of compound floods.
- DestinE provides a unique opportunity for higher-resolution meteorological forecasts and continuous streaming of climate projections
- The progress and results are showcased through distinct case studies
Key recommendations
- To further exploit the added value of the use case demonstrators it is recommended to develop operational pilot services for operational flood impact forecasting that can be integrated in the DestinE infrastructure
- Data import from DestinE and export to users should be fully supported by DestinE APIs in a user-friendly manner
- Uncertainties should be included in compound flood forecasting by developing DestinE ensemble meteorological forecasts
- With the rapid development of AI and its applications in flood forecasting, it is recommended to develop surrogate models/emulators
Challenge
Climate change will result in sea level rise and changes in environmental conditions, such as changing rainfall patterns or marine conditions. At deltas around the world, where the river meets the sea, extreme events such as hurricanes may result in a phenomenon known as compound flooding.
Compound flooding refers to an event in which two or more flooding sources occurs simultaneously or in quick-succession, causing an amplified event that results in more severe impacts. This phenomenon also poses unique challenges owing to the multitude of variables that contribute towards the hazard such as tides, surge, waves, river discharge, precipitation and extreme events such as cyclones.
To support better forecasting and disaster mitigation, higher resolution information is required to deliver information in a timely manner. A unique opportunity is provided by DestinE in that regard, as higher-resolution meteorological forecasts and climate projections can contribute towards keeping people safe from flooding, now and for the future.
Use Case Overview
Deltares, together with its partners KNMI, Tecnalia and 510 Red Cross, developed a digital twin that supports disaster risk reduction and climate adaptation. A generic, globally-applicable modelling framework using open-source model components was applied. Where needed, individual components were refined using local data, thus, applying a “global to local” approach.
A total of five case study areas were selected:
- Basque Country
- United Kingdom
- Philippines
- La Reunion
- Dutch Caribbean Islands (BES Islands)
The diversity in environmental conditions and user needs across the case studies helped in demonstrating the applicability of the service. For each case study area, an end-user was identified, who provided iterative feedback to determine case-specific requirements.
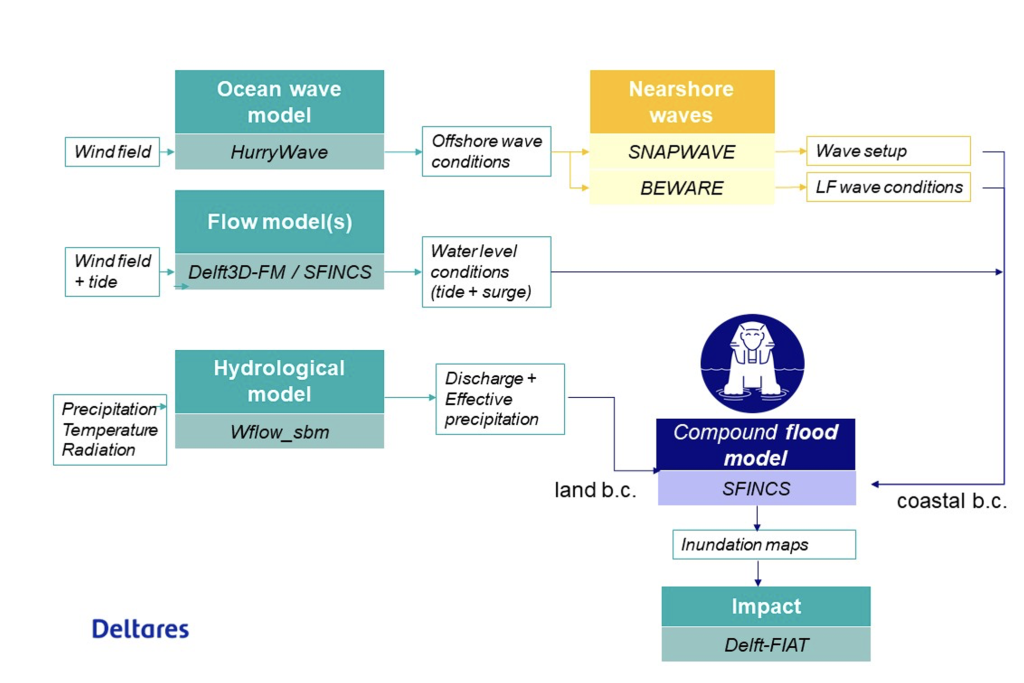
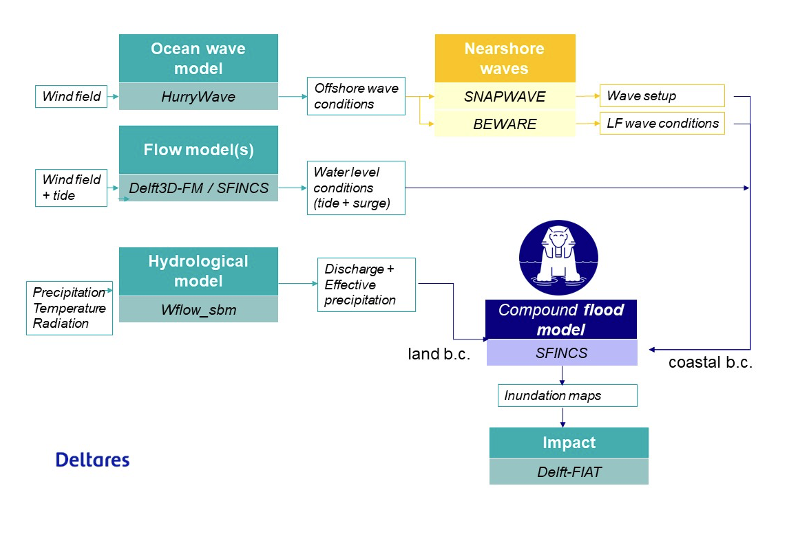
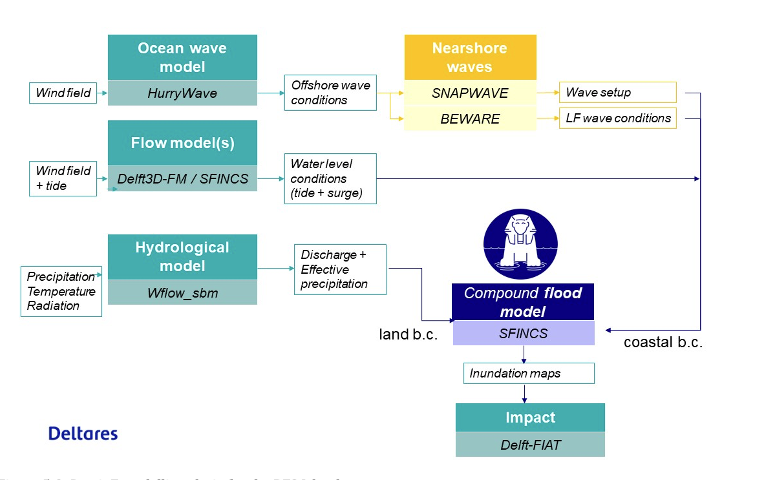
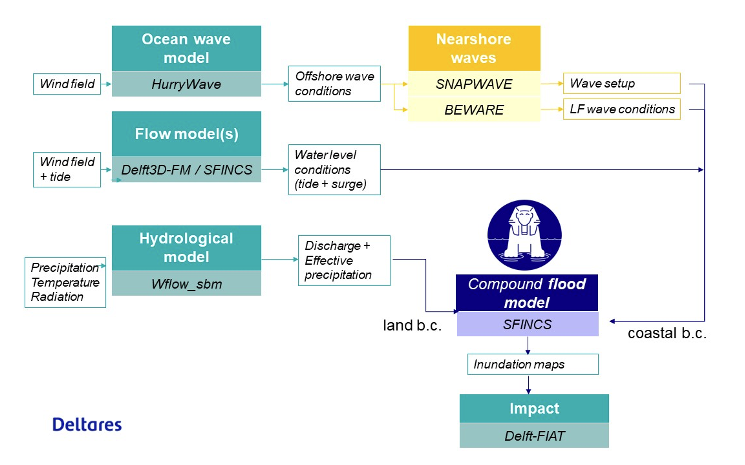
The overall modelling framework follows the same structure for all case study areas, see figure 1.2. The modelling chain exists of locally implemented models and global datasets for simulating the various physical processes. In general, the modelling chain exists of open-source model components from Deltares that can still be replaced by existing user-owned models. The modelling chain has been set up, with as final result flood inundation maps (water depths) translated into flood impact maps. The model implementations are similar for all regions. However, depending on the relevant flood drivers some model components were not included in all workflows. The description of the type of models used for each physical process is described in the following sections.
Modelling of the individual flood drivers
Tide and Storm Surge
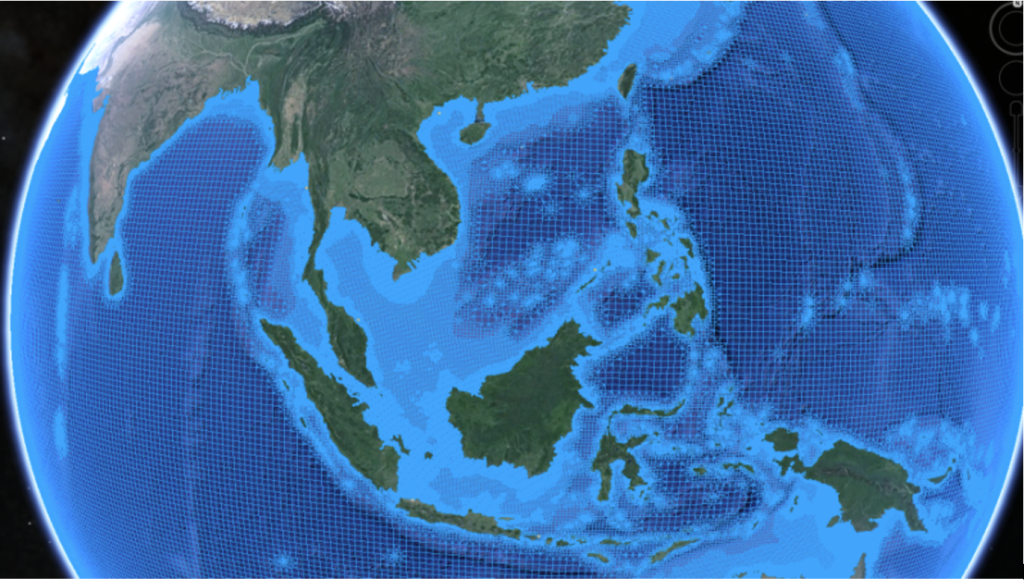
Sea levels comprise effects from astronomical tides, storm surges, wind waves and mean sea level variations, with each component operating on different spatial and temporal scales. Using the in-house Global Tide and Surge Model (GTSM see Figure 1‑3), which makes use of the Delft3D Flexible Mesh (FM) software, tide and storm surges are modelled using depth-averaged hydrodynamic models (2D). A flexible mesh refers to the unstructured nature of the grids used for modelling, allowing for spatially-varying resolutions and higher computational efficiency. As GTSM has a uniquely higher resolution along coastal areas (1-25-2.5km), this makes the software suitable for simulating extreme water levels in events such as tropical cyclones. The GTSM model is extensively validated (Muis et al., 2020[1]; Dullart et al., 2020[2]) and calibrated (Wang et al., 2021[3]; Wang et al., 2022[4]), demonstrating good performance for tide and storm surge simulations.
Waves
Ocean waves originate from the disturbance of the sea surface due to sustained winds, leading to the formation of a random wave field called the wind sea. The dispersion relation of waves governs their behaviour, causing waves with larger wavelengths to travel faster owing to the frequency dispersion. As these waves propagate through the ocean, the random wave field disintegrates, resulting in a decrease in directional spreading owing to directional dispersion. As a result, waves at a considerable distance from their source start to become regular and long-crested, moving in a coherent manner with similar frequencies, otherwise known as swells. The interaction of both sea and
swell waves with slightly differing frequencies gives rise to a third wave type known as the infragravity wave. On the open ocean, infragravity waves exhibit very low heights.
As waves approach the coastal environment, they interact with the increasingly shallow seabed topography and start to transform by shoaling, dissipating energy and transferring energy between various frequencies. This transformation largely affects the swell and infragravity waves, resulting in what is known as wave setup, which refers to the additional elevation of water levels from wave action. In general, wave setup is inversely proportional to the region available for wave breaking. Using the example of coastal areas that are lined with coral reefs, wave setup tends to be particularly large as waves have to break in a very confined area due to steep fore-reefs.
To account for wave setup, various models are used to capture the following parameters:
1. Deep-water wave generation (using HurryWave)
2. Generation of infragravity waves in the nearshore environment (BEWARE and VanOrmondt models)
3. Nearshore setup of mean water levels (SNAPWAVE)
Wave model descriptions
HurryWave – Deep-water wave generation model developed by Deltares to simulate the generation and propaga
tion of sea-swell waves by wind forcing. A third-generation spectral wave model similar to SWAN or WAVEWATCH-III, HurryWave is, on average, an order of magnitude faster than the SWAN model due to its very slightly reduced physics, combined with simpler wave propagation schemes.
SNAPWAVE – Another model developed by Deltares, SNAPWAVE is used to estimate nearshore wave setup within the SFINCS (Super-Fast Inundation of CoastS, described in later sections) model.
BEWARE (Bayesian Estimator of Wave Attack in Reef Environments) – A large synthetic database originally constructed based on approximately 100,000 1-Dimensional XBeach simulations, forced with a range of hydrodynamic conditions (Pearson et al., 2017[5]). XBeach is an open-source model for simulating wave propagation, long waves, mean flow, sediment transport and morphological changes in the nearshore environment.
Van Ormondt (2021)[6] leverages empirical formulations for sandy coastlines to approximate nearshore infragravity wave conditions. The empirical formulations were derived using 1-Dimensional XBeach-NH+ model runs for sandy profiles (XBeach Non-hydrostatic).
Hydrology
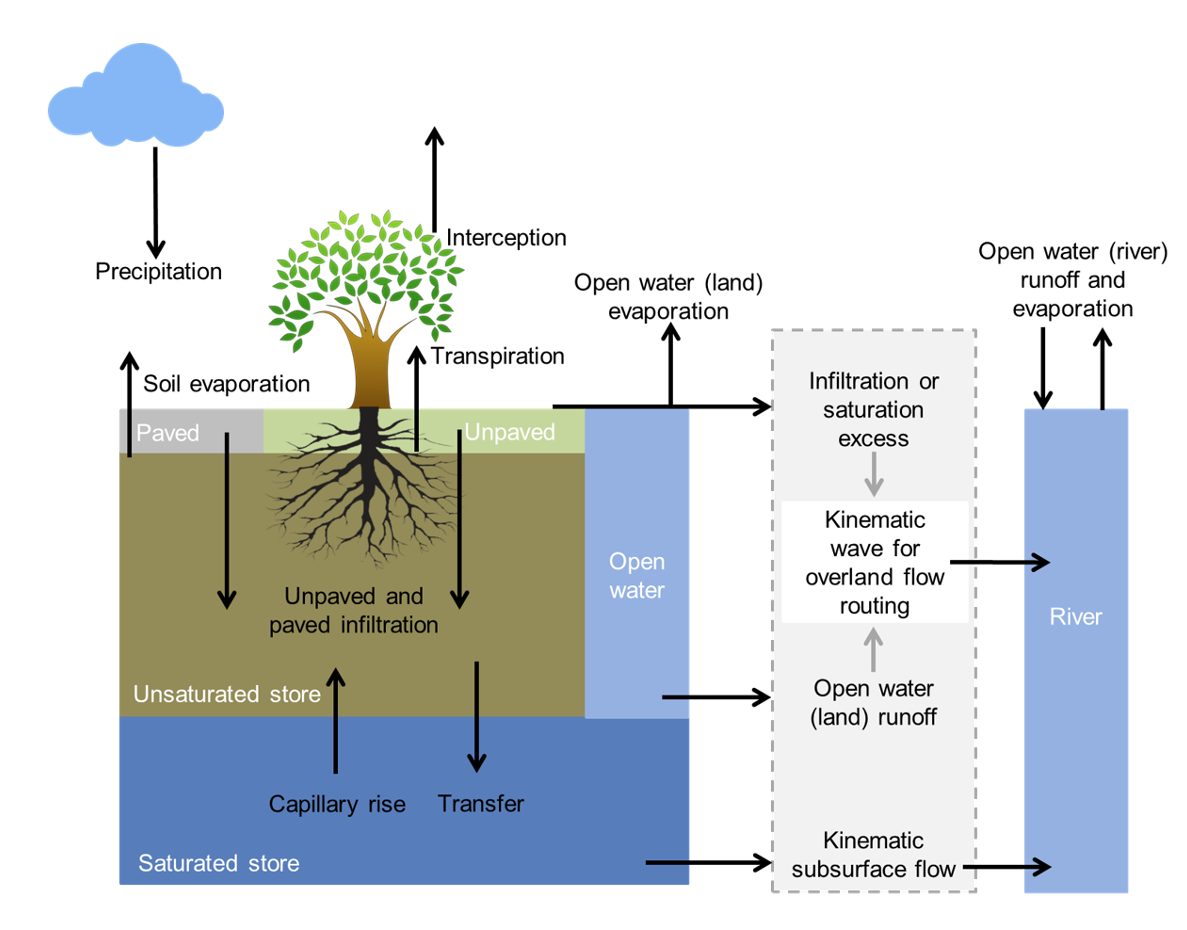
The Wflow_sbm model was implemented to predict river discharges and water levels. Wflow_sbm is a free and open-source distributed hydrological model that maximises the use of global and publicly available datasets. Models can be set-up in an automated fashion for river basins around the globe by using the Wflow plug-in[7] within the HydroMT python package, which is also developed by Deltares. Wflow_sbm incorporates the processes included in Figure 1‑4.
Flood inundation
Flood inundation resulting from compound events is challenging to predict due to large computational effort needed in short periods of time when considering the implications for early warning. Current modelling approaches have their own benefits and disadvantages, such as the ‘bathtub’ approach, which is extremely fast but too simplistic, and numerical models that achieve accuracy but lose out in speed, such as Delft3D or XBeach. As a compromise between these approaches, models that have reduced physical complexity can be deployed instead, resulting in much quicker computations due to the reduction in the number of equations to solve for.
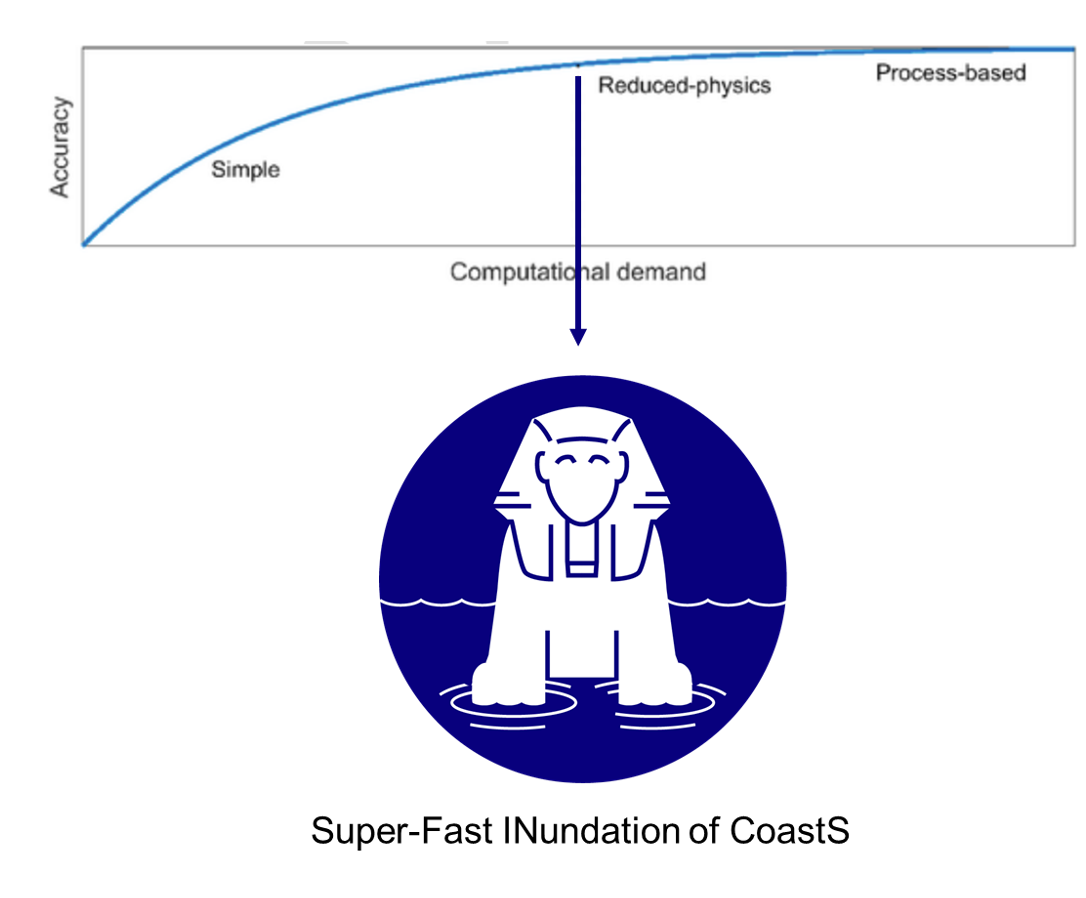
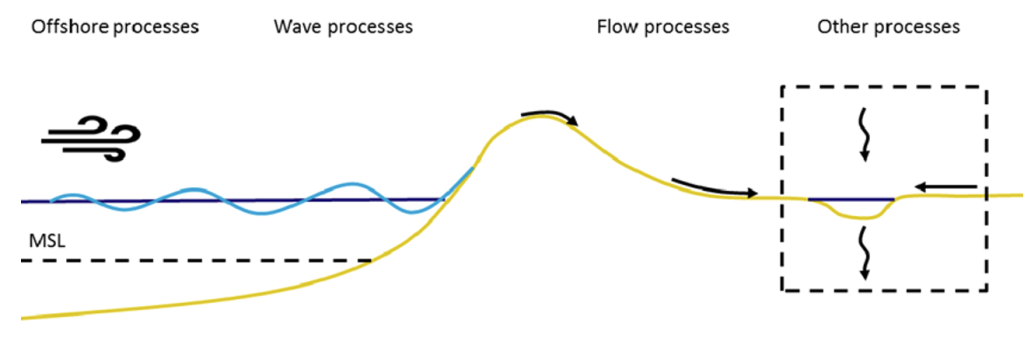
SFINCS (Super-Fast Inundation of CoastS) is one example of a reduced-physics model that is capable of simulating compound flooding with high computational efficiency, balanced with adequate accuracy (Figure 1‑5). Its efficiency makes it suitable for forecasting compound flood events in operational forecasting systems, and includes fluvial, pluvial, tidal, wind- and wave-driven processes (Figure 1‑6).
Flood impact
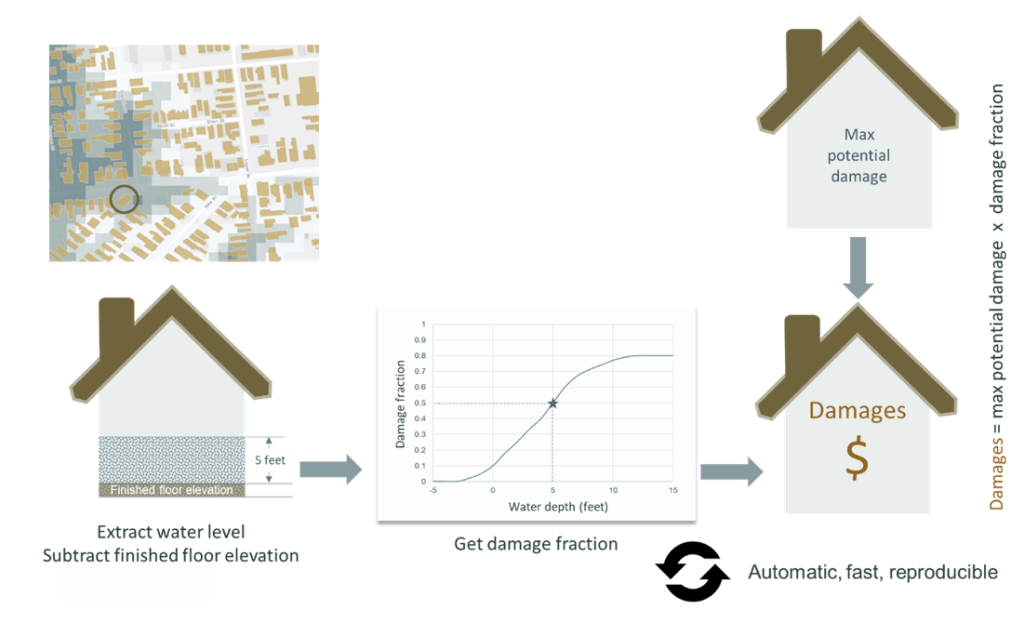
Floods can wreak devastating damages on buildings, services, mobility and may even lead to loss of lives. Modelling floods and potential damages can provide actionable information to decision makers, allowing them to prioritise or plan appropriate interventions on various timescales, such as between a few days (disaster preparedness) to decades in advance (climate adaptation). Delft-FIAT is a fast, open-source Python-based tool developed by Deltares to rapidly assess direct economic impacts to buildings, utilities and transport networks from user-input flood maps (Figure 1‑7). Delft-FIAT is made in a flexible manner, allowing a user to define their own damage functions, include other hazards, or even generate different damage classes.
Case Study: Basque Country
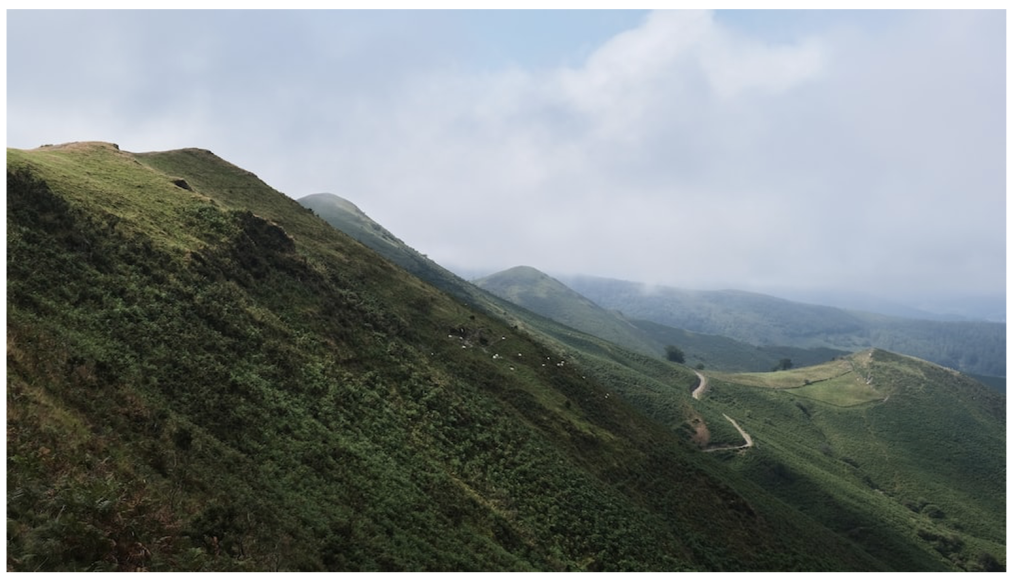
An autonomous community located in the northern part of Spain and the southwestern part of France. Basque Country is known for its diverse culture and landscapes. Like many regions around the world, Basque Country also faces challenges from natural hazards such as flooding, erosion and landslides. Under climate change, these hazards are likely to be exacerbated, resulting in increasing impacts.
Read more
An autonomous community located in the northern part of Spain and the southwestern part of France. Basque Country is known for its diverse culture and landscapes. Like many regions around the world, Basque Country also faces challenges from natural hazards such as flooding, erosion and landslides. Under climate change, these hazards are likely to be exacerbated, resulting in increasing impacts.
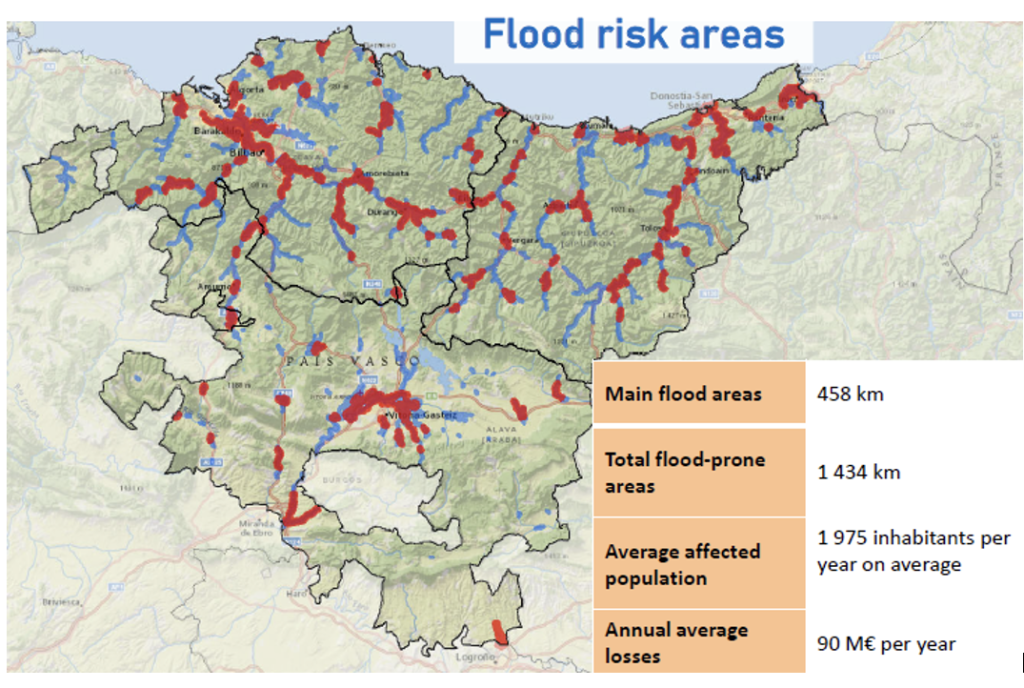
Owing to the region’s topography and steep relief, this makes the region prone to flash floods (see Figure 2‑2). During periods of heavy precipitation the response time can be on the order of less than 1 hour. In recent years, there have been several severe flood events that have caused infrastructural and economic damage in Basque Country, such as the November 2021 floods. Urbanised areas are especially vulnerable owing to the dense urban planning and impact on populations and infrastructures. The Basque Water Agency (URA – Uraren Euskal Agentzia) is responsible for flood mitigation, protection and preparedness within the region, who are also the end users within this project for the Basque Country case study. They focus on four main pillars in their flood management strategy: Prevention, Protection, Preparation and Recovery & Evaluation.
Who is the User?

The Basque Water Agency (URA) is an entity of the Basque Government tasked with the role of carrying out the water policy in Basque Country, including management of water quantity, quality and safety. Due to the long history of flood occurrence in the region, one of the strategies URA undertakes is to promote co-existence with floods, and where needed, flood mitigation measures such as urban planning and protection.
Partners

Tecnalia is the largest center of applied research and technological development in Spain and a member of the Basque Research and Technology Alliance, focusing on the use of technology for societal improvement. Tecnalia regularly works with URA on the development and improvement of the current Delft-FEWS forecasting system for the Basque Country. Within this project, Technalia supports the data exchange and user interaction with URA.
Local digital twin implementation
Figure 2‑3 presents the models from the DestinE Modelling Framework implemented for Basque Country.
High-resolutions Hurrywave models were implemented for the coastline of Basque Country (see Figure 2‑4) to simulate the generation and propagation of sea-swell waves and local wind waves by strong wind. The model is build based upon the global GEBCO19 bathymetry dataset and forced with wind fields from the IFS system.

For the simulation of nearshore waves a BEWARE model was implemented. Hereto coastal transects were extracted from the JRC database. BEWARE is forced with waves from HurryWave and water levels from Delft3D-FM.


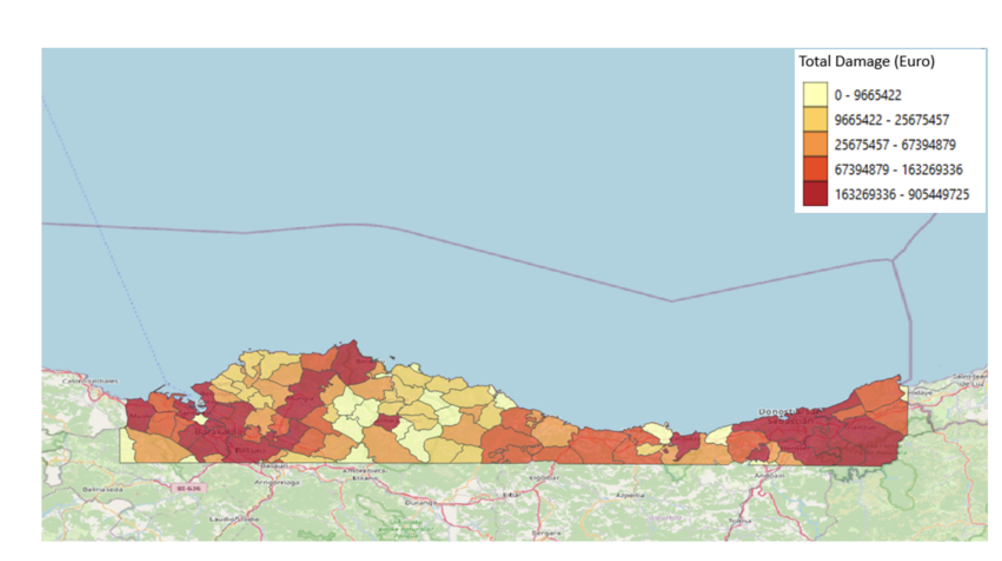
To simulate flood depths and extents the SFINCS model was implemented (Figure 2‑6). The flood map depth maps have been used as input for Delft-FIAT to estimate the damage that was aggregated to admin areas.
Historical events – coastal storm 2014
February 2014 a strong storm caused coastal floodings in the Basque area. During this storm, a deep squall was generated in the Atlantic to the northwest of the British Isles. This squall generated very energetic swell, with significant wave heights of around 8.5 m and a peak period of 20 seconds arriving at the Basque coast. Additionally, the large swell coincided with very strong tides, reaching water levels of 4.93 m, which meant that the estimated overtopping indices were 7.8 and 8.7 m. The event caused the most damage in Basque area in the 21st century with 631 damage reports and more than 18 million euros in losses.
Results and validation
A snapshot of the wave height simulation forced with IFS data during the 2014 storm is shown in Figure 2‑8. Figure 2‑9 shows measured and modelled wave heights for three wave buoys.

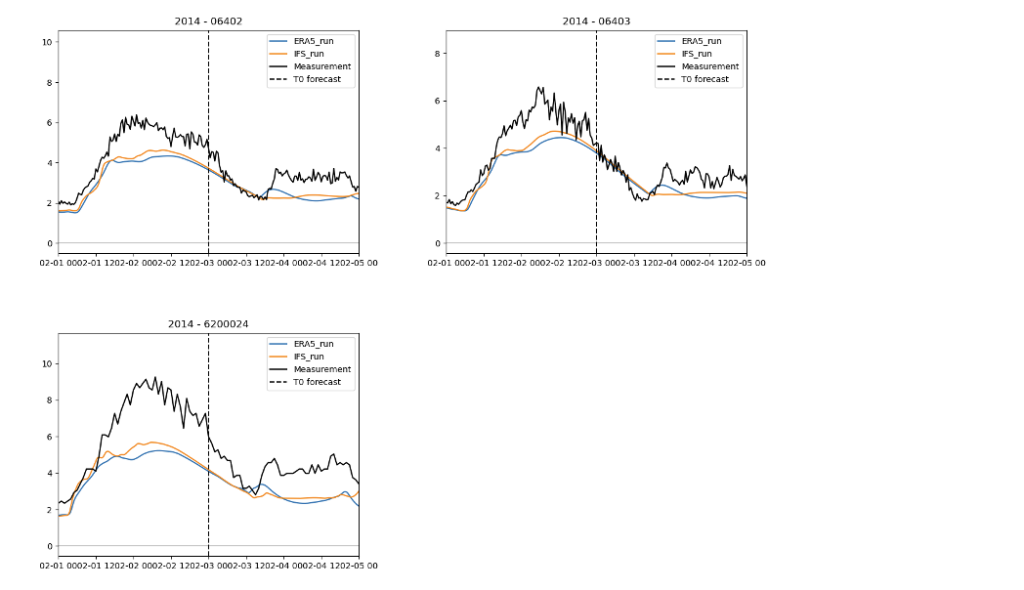
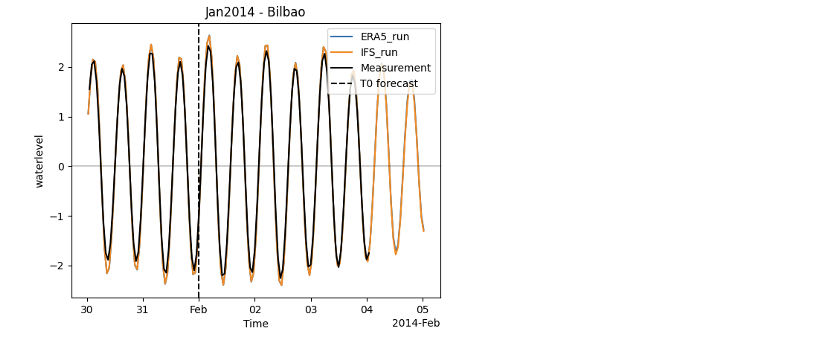
Figure 2‑10 shows the simulated and observed water level timeseries. The different meteorological forcings yield nearly the same results because of the limited occurrence of storm surges and thus the dominance of the waves. The model slightly overestimated tidal amplitudes.
Case Study: La Réunion
The island of La Réunion is a French overseas department situated in the western Indian Ocean and home to the highest peaks in the Indian Ocean. Due to its geographical location and topography, the island experiences several natural hazards such as cyclones, landslides, and coastal and inland flooding. The island holds records for some of the most extreme rainfall events as a result of these cyclones. Some of the most damaging events included Cyclone Denise (1966), Gaméde (2007), Fakir (2018) and Berguitta (2018). During a cyclone, the low-pressure system generates extreme precipitation, storm surge and swells. Combined with its mountainous terrain and exposed coastline, the island is susceptible to flash floods in low-lying areas from both inland and coastal compartments. Floods have socio-economic consequences for the island, such as population safety and damages to businesses, assets and infrastructure.
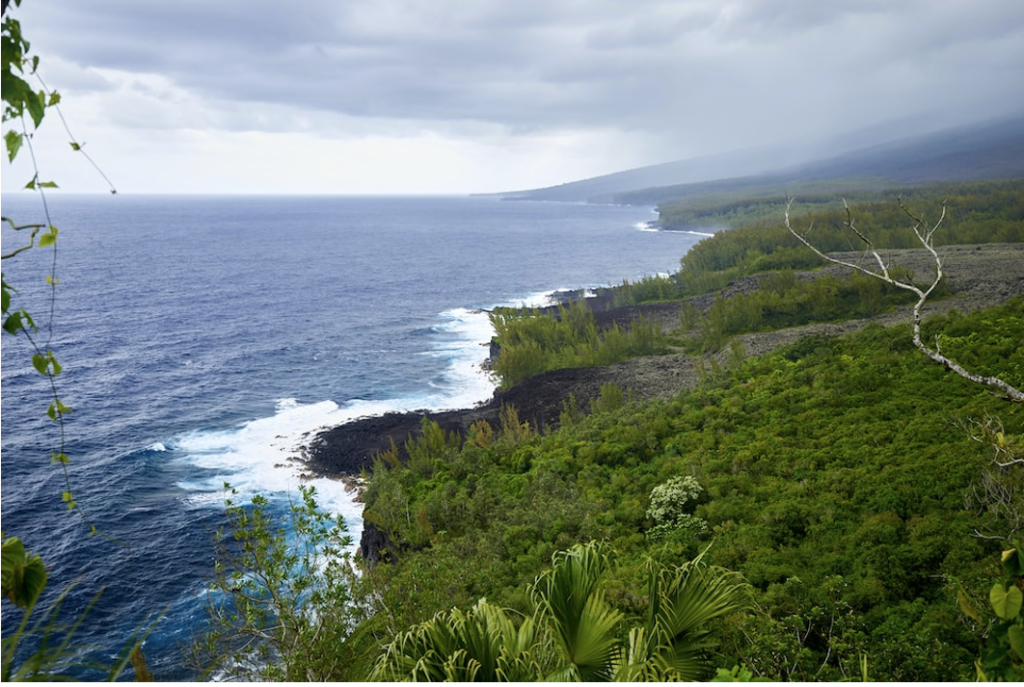
To overcome compound flood hazards, the island has implemented various measures including early warning systems, land use planning and infrastructure improvements. However, the unique geographical characteristics of La Réunion presents ongoing challenges in managing these hazards and protecting vulnerable communities. Currently, emphasis is placed on ensuring a good and reliable forecasting system is in-place. In this respect, DEAL (Direction de l’Environnement de l’Aménagement et du Logement de La Réunion) is the primary agency responsible for flood forecasting and management on the island, and is the La Réunion user within the DE370A_Deltares project.
Read more
The User
DEAL is the department of environment, planning and housing of La Réunion. In particular, the Cellule de Veille Hydrologique (CVH – Hydrological Watch Cell) is responsible for flood forecasting, flood vigilance, evacuation and mitigation. With a total of 8 agents stationed on the island and 29 monitoring stations for 17 sub-catchments, DEAL is primarily interested in robust forecasting results to support rapid evacuation or intervention if needed.

Partners

Surface Libre is a company specialising in consultancy services to provide training and support for hydrological and hydrodynamic modelling. They are currently developing the 3rd real-time modelling system for La Réunion. Owing to their experience working in La Réunion and with DEAL, Surface Libre is helping to distil and translate user requirements within this project.
Local Digital Twin implementation
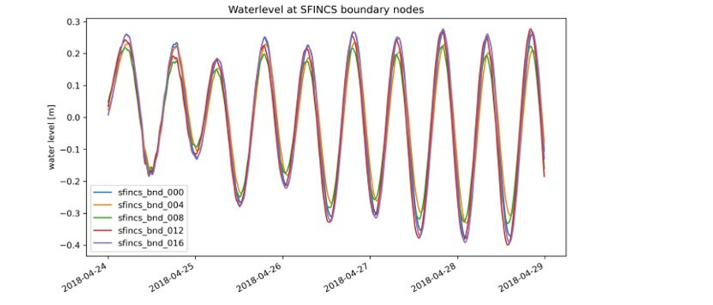
The Delft3D-FM hydrodynamic model for La Reunion was largely automatically generated. The Delft3D-FM model takes the data from the Global Tide and Surge Model (GTSM) as boundary condition, but has a much higher resolution itself. Especially close to the coast the resolution is rather fine to account for local bathymetry variations (see Figure 3‑2).
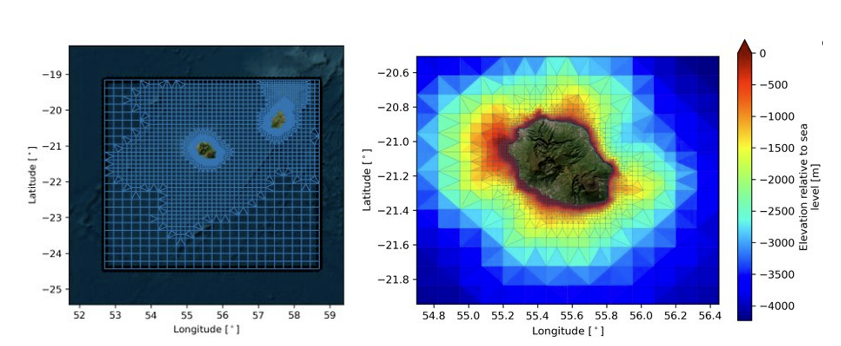
This Delft3D-FM model supplies surge and local tidal boundaries conditions to the nearshore wave model (BEWARE) and the flood inundation model SFINCS (see Figure 3‑3).
For the simulation of rainfall-runoff processes the spatially distributed wflow_sbm hydrological model is implemented for the entire Island (Figure 3‑4). The model has a resolution of 1 km and provides hourly discharge time-series that are used as boundary conditions for the SFINCS flood inundation model.
Figure 3‑4: The implementation of the hydrological wflow_sbm model for La Reunion (left) and the discharges simulated for the 2012 event Fakir. These discharge time-series are used as boundary conditions for the different river inflow points of the SFINCS model grid.

Figure 3‑5 shows the setup of the HurryWave model that simulates the generation and propagation of sea-swell waves and local wind waves by strong wind. The model is build based upon the global GEBCO19 bathymetry dataset and forced with wind fields and atmospheric pressure from spiderweb for the FAKIR event.

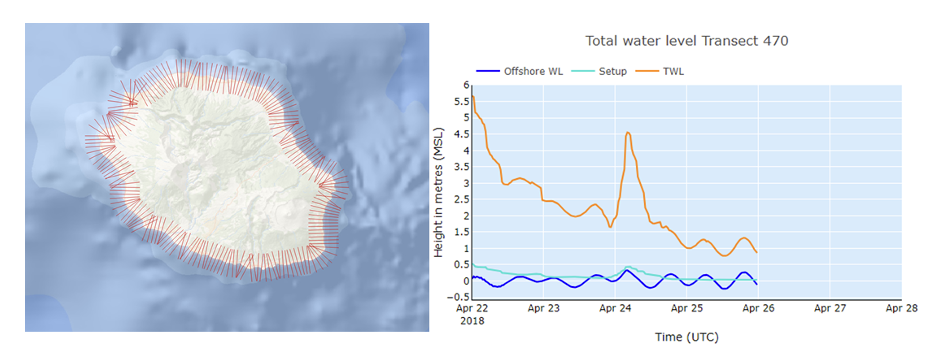
The BEWARE model was implemented for the generation of infragravity waves in the nearshore environment. The model uses coastal transects from the nearshore slope datasets constructed in a collaboration between Deltares and JRC[09]. Figure 3‑6 displays the wave runup (metres) above MSL for cyclone Fakir.
Finally, the SFINCS model is implemented and run using river flow from wflow_sbm and coastal water level data from Delft3D-FM and wave models as boundary condition. The resolution of the SFINCS model is 200 metres. The model domain is based on watershed delineation and elevation. It extends from -50 metres in the sea up to 100 meter elevation over land. Figure 3‑7 displays the SFINCS domain (left) and the maximum water depths over land simulated for the Fakir event (right).

Historical events
Two historical events are simulated (Tropical Cyclone Fakir, 2018 and Tropical Cyclone Bélal, 2024) to assess the accuracy of the prediction and sensitivity of the compound flooding to different types of storms.

Results and validation
Deep-water waves around La Réunion are simulated with HurryWave, using a large-scale model for the Indian Ocean (50 km resolution), a regional model (20 km resolution), and a local model around La Réunion (1 km resolution). An example of a wave height simulation forced with DT Extreme data is shown in Figure 3‑9.

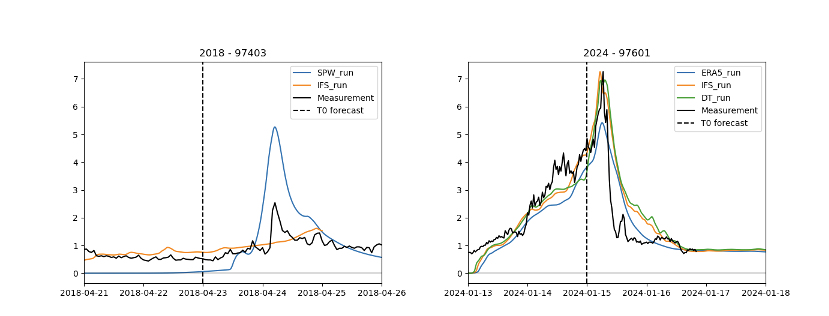
Both TC Fakir and TC Bélal were modelled with ERA5, IFS and DT Extremes. For TC Fakir, the IFS forecast data show an underprediction of wave heights at the peak, but accurate predictions outside the exact wave height peak. For TC Bélal, both the IFS and DT Extreme forced simulations perform well (Figure 3‑10, right plot). Simulations forced with ERA5 underpredict extreme wave heights.
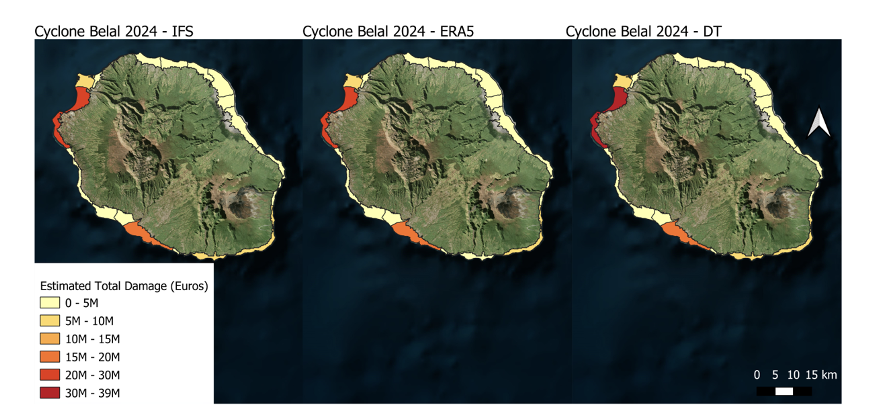
The total damages estimated with the Delft-FIAT model vary between the different meteorological inputs for Cyclone Bélal, with IFS estimated at €93 million, ERA5 at €87 million and DT Extreme at €100 million. DT Extreme shows higher flood depths and extent, particularly in the northern region of Saint-Paul, resulting in higher damages.
Case Study: Humber Estuary, UK
In the United Kingdom (UK), the main drivers of flood risk are rainfall, tides and storm surges, while secondary risk drivers are from wave overtopping and wave setup. Currently, flood risk management is well developed, given the many flood defenses and flood forecasting capabilities. However, climate change brings about uncertainties in frequency and intensity changes. As such, compound flood events may happen more frequently in deltaic or estuarine areas. Due to the complex interaction between riverine and coastal components, compound flooding is more difficult to model, making estuaries especially interesting.
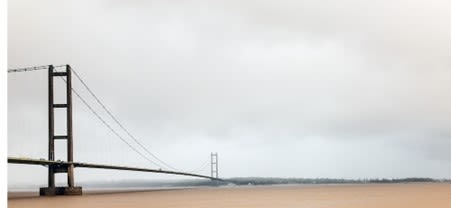
With this in mind, the Humber area is an interesting case study area to explore within this project. The Humber Estuary is located in the eastern part of England. Its low-lying nature, along with its vast catchment area, makes it highly vulnerable to flooding. It is an estuary with a high population density, combined with industrial and agricultural activities. Owing to its dense urban planning, flood risk is high in this area due to the broad potential impacts, with the notable floods of December 2013. Within the Humber area, a mix of hard and soft measures are presently implemented to reduce the risk of coastal flooding and erosion.
Read more
The user
The Environment Agency is the government agency primarily responsible for flood risk management in England. Their flood and coastal risk management services include: 1) Flood incident management for forecasting, warning and response 2) Asset management for maintaining, operating, improving, building or creating assets 3) Strategy and investments for understanding risk, planning and defining investment needs, and detailed design and options appraisal. The Environment Agency and Deltares has a long working relationship, as the UK was one of the first countries where a Delft-FEWS forecasting system was implemented.

Local Digital Twin implementation
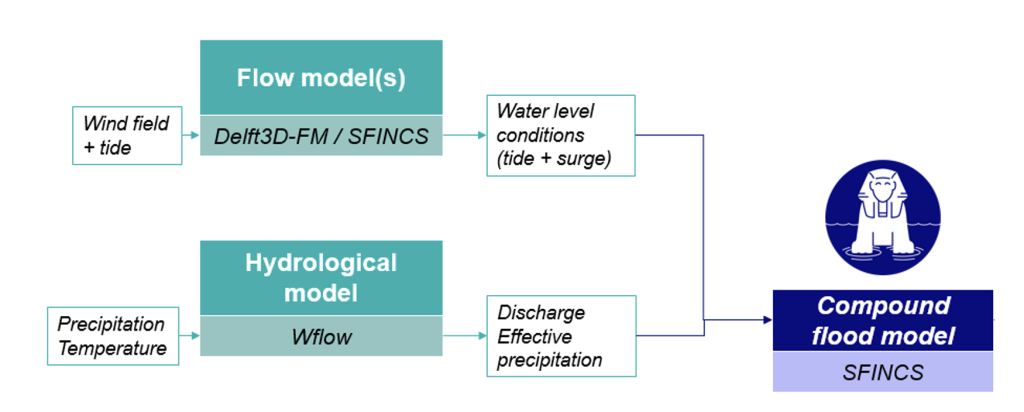
The model chain for the Humber estuary includes a sub-selection of model from the full DestinE Modelling Framework (see Figure 4‑2).
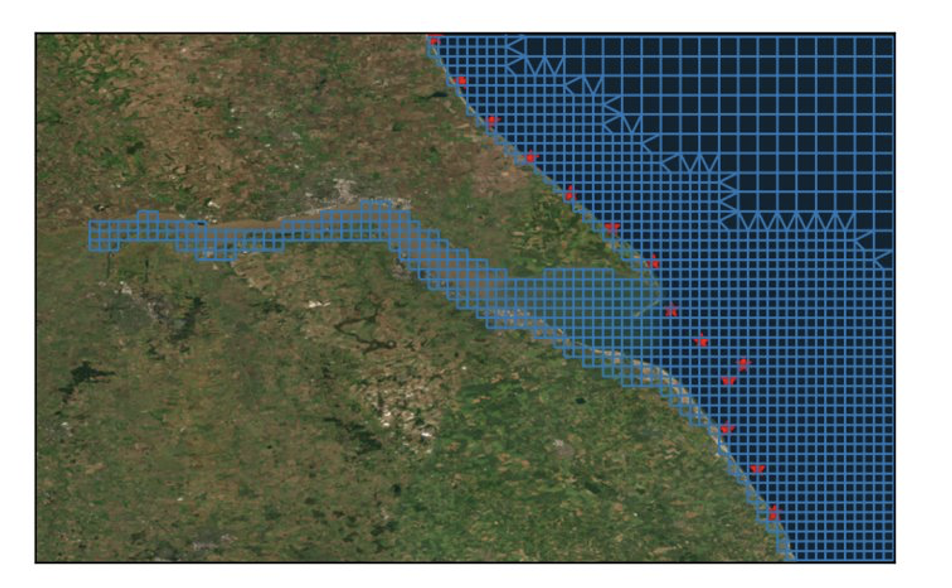
We implemented the Delft3D-FM model (see Figure 4‑3) for the simulation of sea water levels and tights for La Reunion largely automatically. The flexible mesh model grid increases in resolution close to the coast and in the estuary.
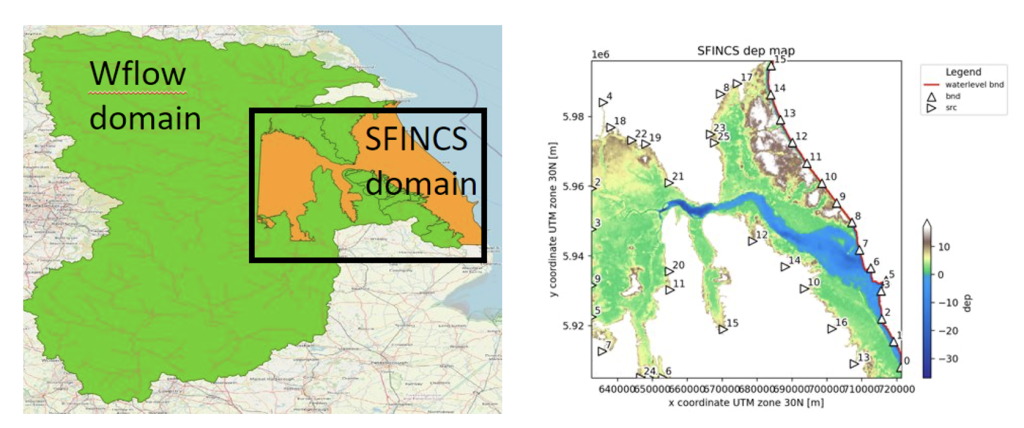
The hydrological model wflow_sbm is implemented for the entire upstream catchment area. Close to the coast and in the estuary the hydrodynamics are simulated with the flood inundation model SFINCS (see Figure 4‑4).
Historical events
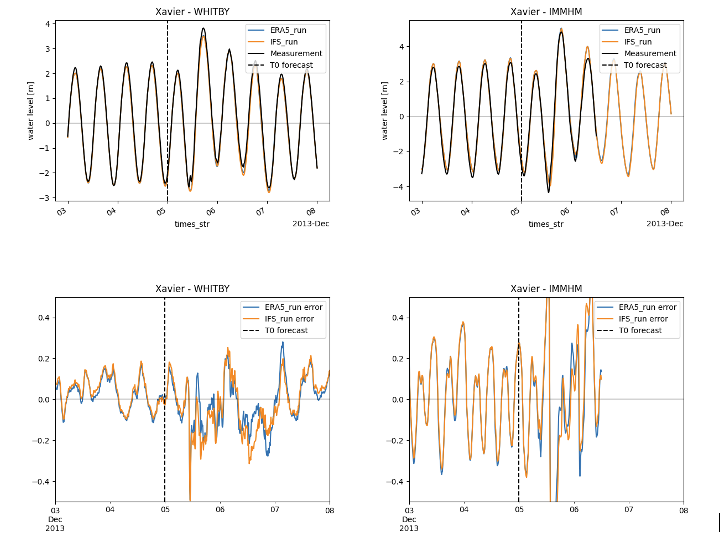
The final datasets focus on two extreme historical events. Namely, Storm Xavier on December 5th and Storm Chiara on February 9th 2020.
Strom Xavier: On December 5th, 2013, a large and deep low-pressure system developed over the North Sea. The resulting storm surge that coincided with spring tides caused severe flood risk for Northern Europe. In the Humber Estuary, it resulted in the highest water levels in measurement history. In the Humber Estuary 1100 properties and over 7000 hectares of land were flooded. The tidal surge also had a significant impact on industry and infrastructure around the estuary, which had cascading effects on trade, transport and production.
Storm Ciara started on the February 8th, 2020, and produced close to the long term monthly average rainfall within just 24 hours over the Pennine slopes of West and North Yorkshire. These catchments responded rapidly with record or near record river levels at many locations and especially in the Colne and Calder rivers where flows exceeding the 1 in a 70 year return period were recorded. River levels in the lower reaches of these catchments also ranked high in the historic record. The large volumes of water accumulating in the lower and tidal reaches caused washlands to fill, which proved to be an important factor in subsequent events later that month.
Results and validation
Predicted coastal water levels of historical events were validated (see Figure 4‑5). In particular, the model accuracy during Storm Xaver is important because of the record-breaking magnitude of the measured storm surge during that event.
Validation of Storm Chiara in 2020, for which also DT Extremes data is available, is presented in Figure 4‑6. The timeseries of water levels again show that water level peaks are captured rather well, with slight overestimation at Immingham (IMMHM) mostly due to tidal errors. Differences due to different meteorological forcing fields are relatively small. DT Extreme results are very close to IFS for the first two days of the forecast period.
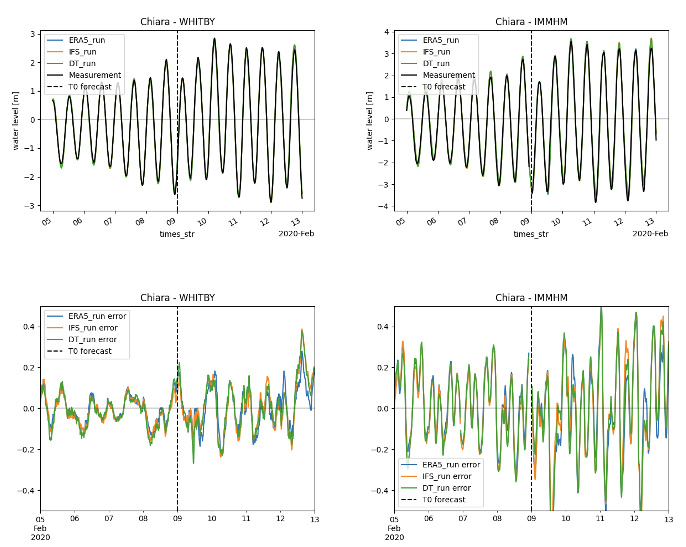
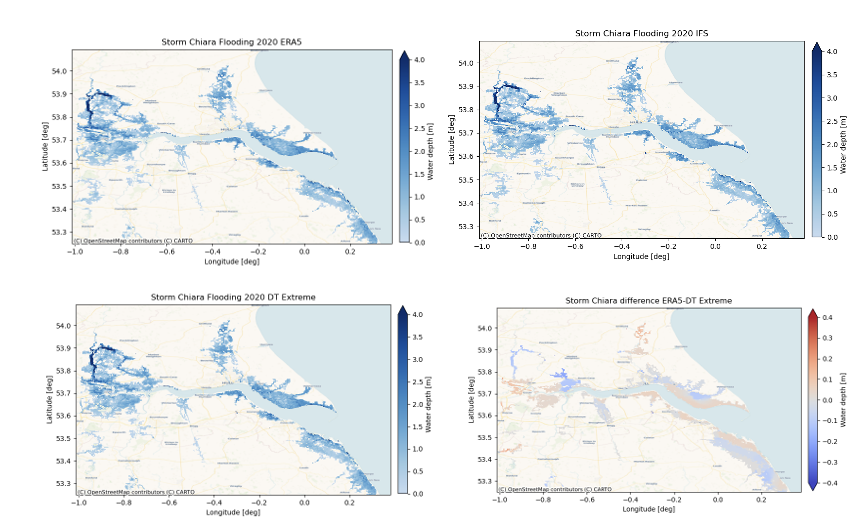
Figure 4‑7 displays the flood maps for Storm Chiara. We can clearly see that fluvial flooding mainly occurs in the northwest, coinciding with the area of highest precipitation and highest simulated discharges. Analysis of the precipitation data revealed that the differences between the forecast products was rather large. The map on the bottom right shows the difference between the water depths simulated with ERA5 and DT Extremes.
Case Study: Dutch Caribbean Islands (BES)
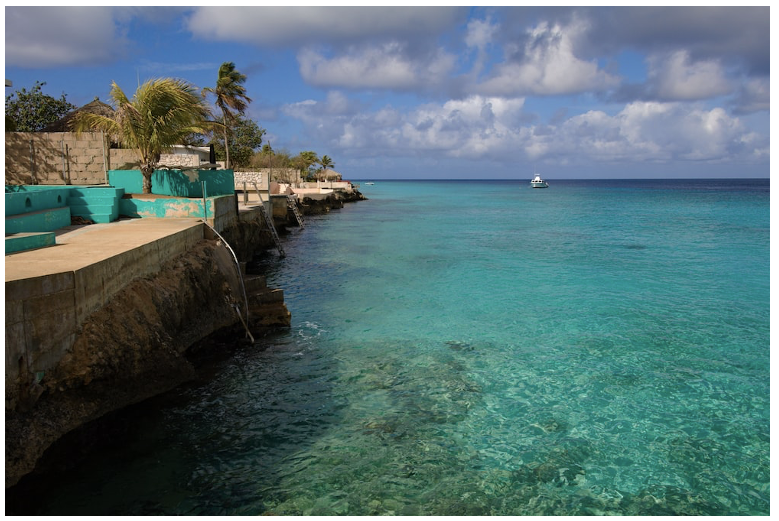
Located in the hurricane belt, the BES islands are vulnerable to tropical cyclones that form in the Atlantic Ocean during the hurricane season between June to November. Hurricanes are a destructive force of nature, bringing in heavy rainfall, high wind speeds, storm surges, coastal and inland flooding. These hazards can damage critical infrastructures and threaten the safety and well-being of local communities. As small islands with highly exposed coastlines, other coastal hazards such as erosion and sea level rise can result in loss of beaches and coastal habitats, as well as threaten freshwater resources due to salinization. The low-lying nature of the island makes them more susceptible to such hazards. Under climate change, these islands remain more vulnerable than ever, and will require adaptation measures to protect the coastal environment and communities. The focus in this project is on Sint Maarten.
Read more
The User
The Water Management Centre of the Netherlands (WMCN – Watermanagementcentrum Nederland) within Rijkswaterstaat (agency under the Dutch Ministry of Infrastructure and Environment) is the knowledge and information centre for the Dutch water system. Dutch water managers work at the regional and national level within the centre and aims to contribute towards uniform and optimal management of the Dutch water system. By collaborating together with the Dutch Meteorological Institute (KNMI), regional water boards, provinces, security regions and knowledge institutes, WMCN leverages this platform to be able to perform its duties to the best of their abilities and available knowledge.

Partners
The Royal Netherlands Meteorological Institute (KNMI) is the national research and information centre for weather, seismology, climate and climate change in The Netherlands. With its long tradition in operational and scientific activities, the climate research undertaken at KNMI aims at observing, understanding and predicting changes in the climate system. KNMI offers products and services that contribute to the safety, accessibility, sustainability and prosperity of the Netherlands. Within this project, KNMI will be responsible for the data interface to the BES islands. KNMI, WMCN and Deltares have a long and strong history of collaboration on flood forecasting, river management and climate adaptation for the Netherlands.
Local Digital Twin implementation
The model chain for the BES Islands includes a sub-selection of models from the full DestinE Modelling Framework (see Figure 5‑2).
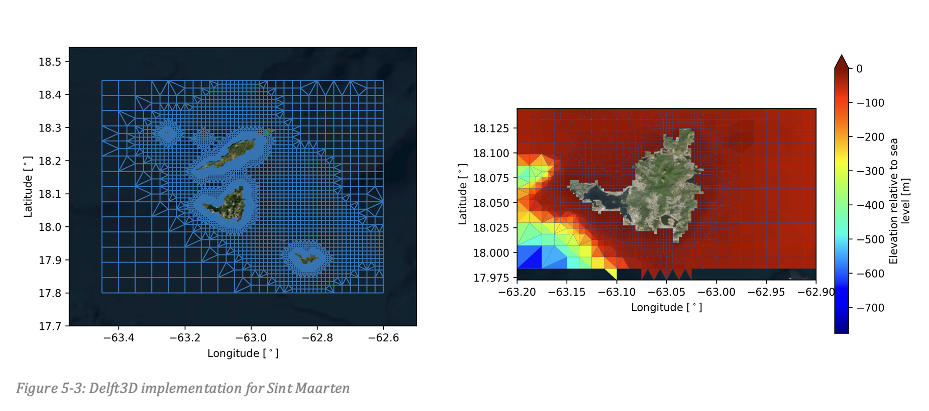
A local Delft3D model (Figure 5‑3) was implemented for the ocean around Sint Maarten to downscale the GTSM simulations to the coast.
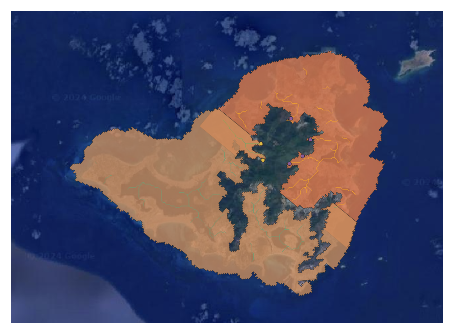
Wflow was implemented for the entire island (at 1km resolution), SFINCE was set-up in two parts with a resolution of 20-80 meters.
Historical events
Hurricane Tammy was a category 2 hurricane that passed by the island of St. Maarten on the 22nd of October 2023. The hurricane was originally predicted to pass the island very closely and to cause heavy damage, however in the end it passed about 100km from the island. Although the hurricane did not lead to very heavy damage, still wind speed of over 120 km/h was recorded and an amount of 10-20mm of rain fell during the event. Storm surges at the Leeward Islands of about 30-90 cm were recorded, according to the Caribbean Disaster Emergency Management Agency.
Results and validation
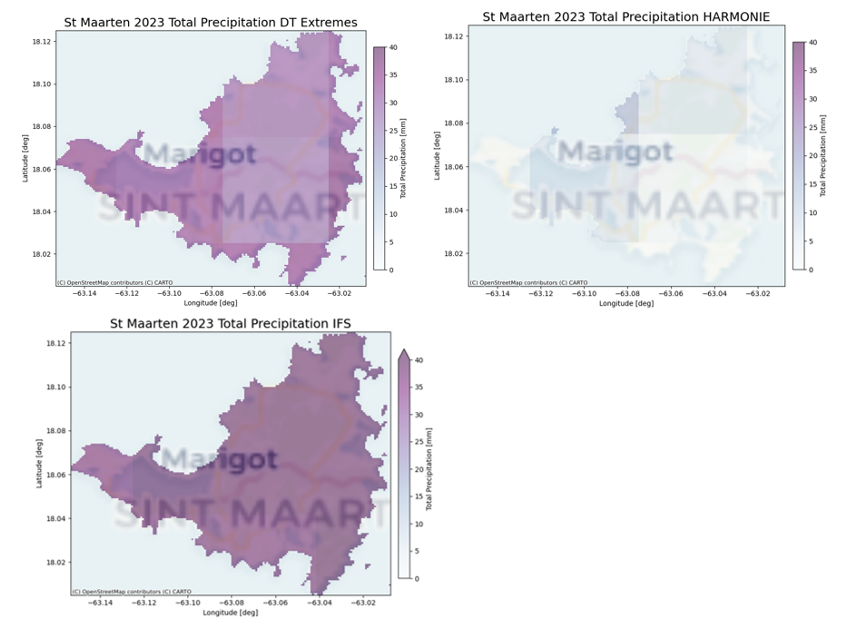
For cyclone Tammy, three meteorological datasets are available.
- HARMONIE, a meteorological product of the Netherlands Royal Meteorological Organization (KNMI)
- ECMWF IFS
- DT Extremes
- Rainfall amounts are quite similar for DT Extremes and for IFS (see Figure 5‑5). Harmonie predicts far lower amounts of rain.
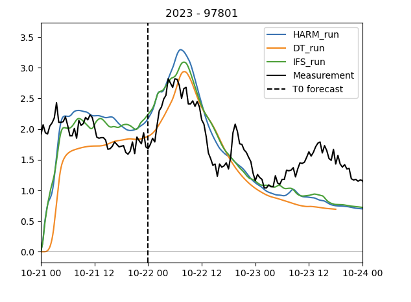
Hurricane Tammy brought about large waves that travelled across the Caribbean. Near St Maarten, waves of over 3 m were observed. Mainly the eastern side of St Maarten was affected by the generated storm waves. The peak wave heights were well predicted by the HurryWave model, especially when forced with DT Extremes winds (see Figure 5‑6).
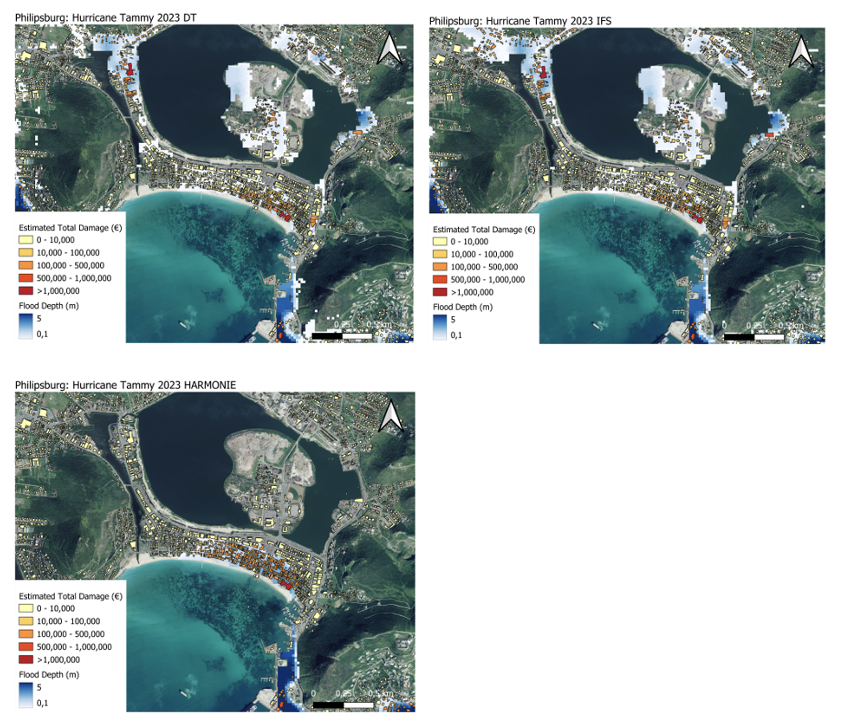
In Simpson Bay, the HARMONIE model shows high flood depths of 3 to 4 metres along the bay, with residential areas experiencing estimated damages between €100,000 and €500,000, while larger buildings incur damages exceeding €1,000,000 (see Figure 5‑7). The IFS model reflects similar flood depths along Simpson Bay but extends flooding into the marina, where flood depths range from 0.3 to 3 metres, and building damages are estimated between €100,000 and €500,000. The DT model mirrors the IFS results, with similar flood depths and damage estimates but slightly lower flood depths in the marina, where damages per building fall within the €0 to €10,000 range (see Figure 5‑7).
Case Study: Philippines
The Philippines is an archipelagic nation consisting of over 7000 islands, resulting in a highly exposed coastline. The Philippines has an extensive coastline of over 36,000 km, as such, coastal flooding is also a prominent natural hazard in the country. Rising sea levels, storm surges and high tides pose risks to coastal communities. Human practices such as groundwater extraction, land reclamation and rapid urbanisation have all contributed to increasing both the risk and vulnerability of many coastal communities. Located along the Pacific Typhoon Belt, The Philippines experiences an average of 20 typhoons per year. In such an extreme event, heavy precipitation, intense wind, storm surge and landslides result in devastating damages and loss of lives. Past occurrences such as Typhoon Haiyan (2013) Typhoon Melor (2015) and Typhoon Mangkhut (2018) resulted in catastrophic damages to infrastructure, agriculture and communities.
The risk of flooding in the Philippines will likely continue and potentially increase in severity and frequency with climate change. Early Warning Systems are an important tool for Forecast-based Financing (FBF), a mechanism that releases humanitarian funding based on forecast information. Using data-driven and physics-informed modelling approaches, the data modelling arm of the Red Cross (510) uses impact-based forecasting to support the Philippines Red Cross in their humanitarian efforts. As such, 510 is the main user within this project.
Read more
The User
510 is an initiative of the Dutch Red Cross and is the data modelling centre to support various global Red Cross activities. 510 undertakes a strong data-centered approach and utilises state-of-the-art technology to improve humanitarian aid access and disaster risk mitigation globally, such as machine learning and block-chain technology.

Local Digital Twin implementation
The model chain for the Philippines includes a sub-selection of models from the full DestinE Modelling Framework (see Figure 6‑2).
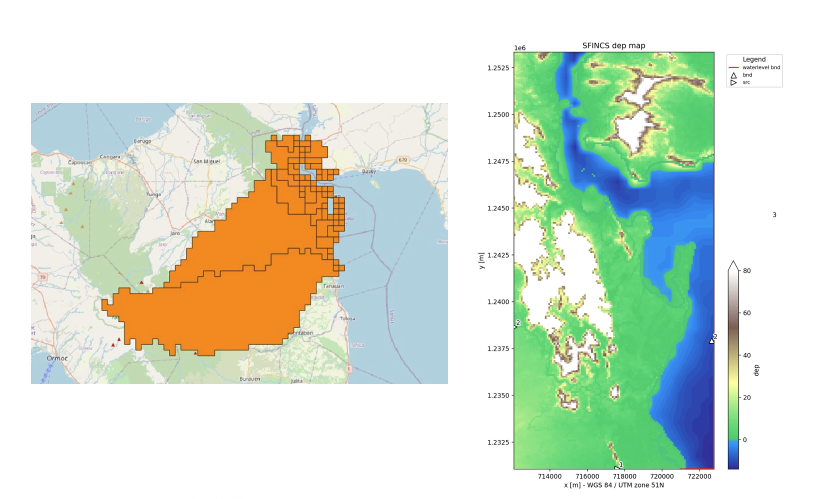
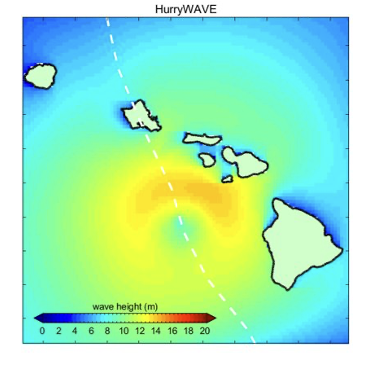
As part of the modelling framework we implemented wflow_sbm for the upstream basin and SFINCS for the coastline around Tacloban (Figure 6‑3) and a HurryWAVE model for the ocean surrounding Tacloban (Figure 6‑4.)
Historical events
Typhoon Haiyan, also known as Super Typhoon Yolanda, struck the Philippines on November 8, 2013. It was a category five typhoon—one of the most powerful to hit the country. With wind speeds reaching 314 kilometers per hour, Haiyan caused widespread devastation. The storm surge, heavy rainfall, and strong winds led to the loss of 6,000+ lives, injuries to nearly 30,000 people, and displacement of 4.1 million people. The economic impact exceeded $12 billion USD, and the environmental consequences were significant.
Results and validation
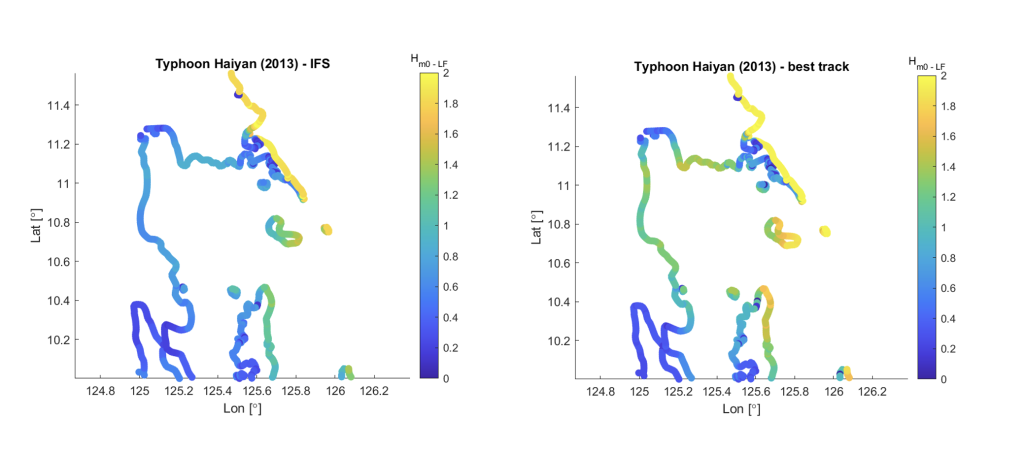
Along the entire Eastern Samar and Gulf of Leyte, the resulting nearshore low-frequency wave conditions were predicted by BEWARE (see Figure 6‑5). Particularly on the Eastern Samar coast, exceptionally energetic extreme wave conditions were predicted, consistent with observations of flooding, e.g. in the village of Hernani.
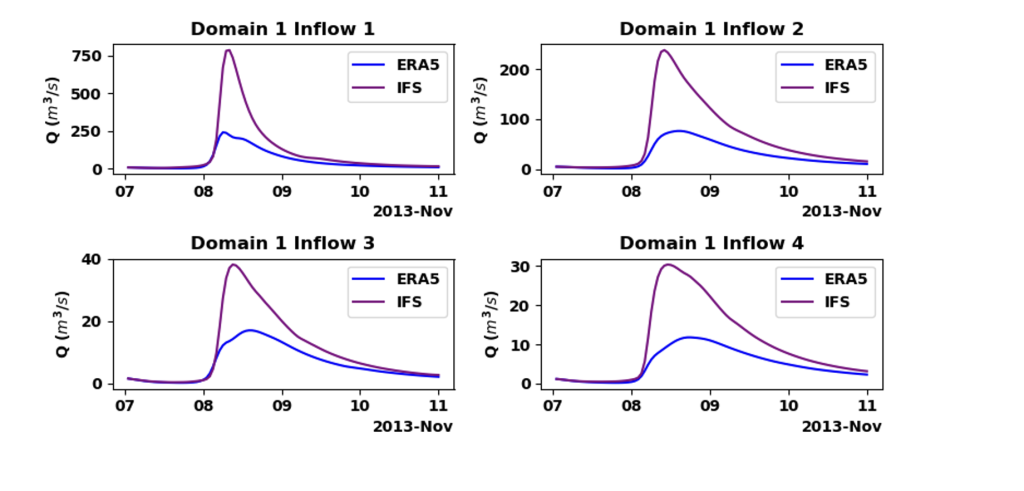
The hydrological model is forced with ERA5/SPW and IFS data for the Hayan event. Figure 6‑6 shows the results of these simulations. The discharge peaks for the IFS simulation experiment are more than twice as high. IFS has an almost three times higher resolution then ERA5 and it is known that ERA5 does not perform well for modelling precipitation for tropical cyclones (Lavers, et al. 2022)[10].
SFINCS has been implemented for the region around Tacloban with a resolution of 20-80m. Figure 6‑7 shows that flood extents and flood depths are a lot larger for the ERA5/SPW run. The floodings during this event were mainly driven by coastal processes including very high waves and a storm surge.
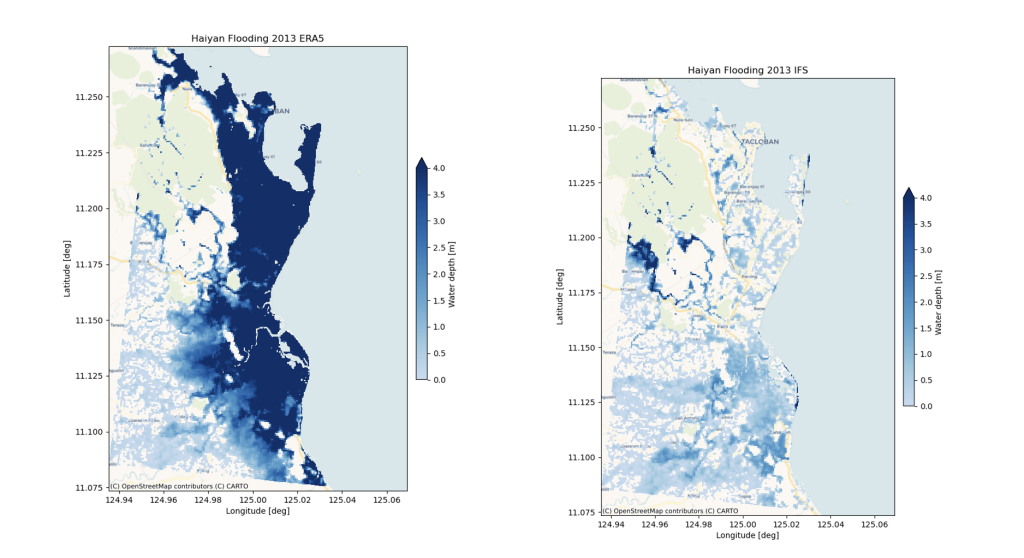
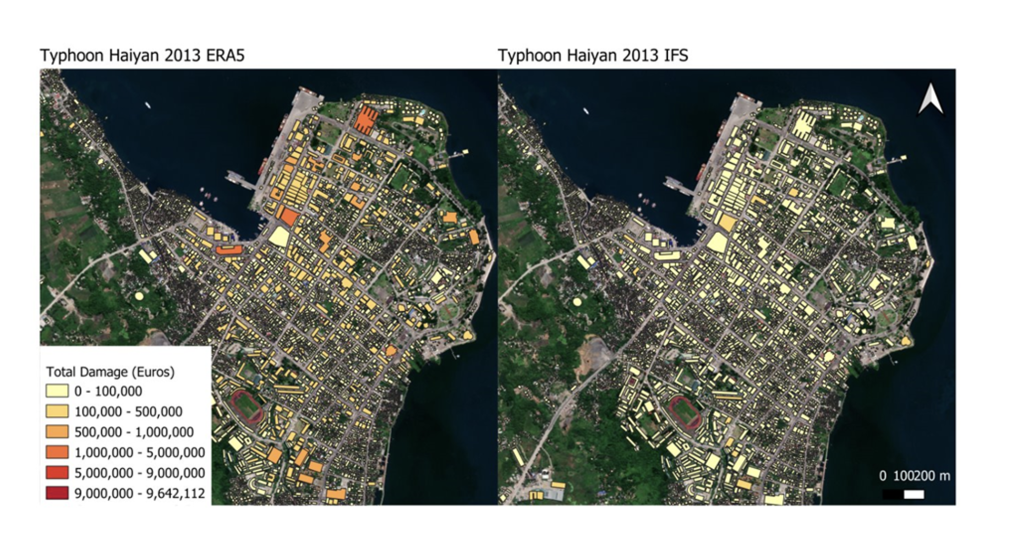
Figure 6‑8 displays the estimated damage (€) per building from the two simulation experiments. Due to the much lower flood depths in the ERA5 simulations, also the damage per building is much lower.
510 expressed a strong interest in the newly developed compound flood forecating workflow. Jointly we designed a forecasting workflow based on the DestinE compound approach that can in the future be integrated in their existing flood impact modelling workflow (Figure 6‑9.

Video presentation
Watch the video below to learn more about the use case on Disaster Risk Mitigation & Climate Adaptation.
Sources:
[1] Muis S, Irazoqui Apecechea M, Dullaart J, de Lima Rego J, Madsen KS, Su J, Yan K and Verlaan M (2020) A High-Resolution Global Dataset of Extreme Sea Levels, Tides, and Storm Surges, Including Future Projections. Front. Mar. Sci. 7:263. doi: 10.3389/fmars.2020.00263
[2] Dullaart, J.C.M., Muis, S., Bloemendaal, N. et al. Advancing global storm surge modelling using the new ERA5 climate reanalysis. Clim Dyn 54, 1007–1021 (2020). https://doi.org/10.1007/s00382-019-05044-0
[3] Wang, X., Verlaan, M., Apecechea, M. I., & Lin, H. X. (2021). Computation‐efficient parameter estimation for a high‐resolution global tide and surge model. Journal of Geophysical Research: Oceans, 126(3). doi:10.1029/2020jc016917
[4] Wang, X., Verlaan, M., Veenstra, J., & Lin, H. X. (2022). Data-assimilation-based parameter estimation of bathymetry and bottom friction coefficient to improve coastal accuracy in a global tide model. Ocean Science, 18(3), 881–904. doi:10.5194/os-18-881-2022
[5] Pearson, S. G., Storlazzi, C. D., Van Dongeren, A. R., Tissier, M. F. S., & Reniers, A. J. H. M. (2017). A Bayesian‐based system to assess wave‐driven flooding hazards on coral reef‐lined coasts. Journal of Geophysical Research: Oceans, 122(12), 10099-10117.
[6] van Ormondt, M., Roelvink, D., & van Dongeren, A. (2021). A model-derived empirical formulation for wave run-up on naturally sloping beaches. Journal of Marine Science and Engineering, 9(11), 1185. doi:10.3390/jmse9111185
[7] Eilander, D., van Verseveld, W., Yamazaki, D., Weerts, A., Winsemius, H. C., and Ward, P. J. 2021. A hydrography upscaling method for scale-invariant parametrization of distributed hydrological models. Hydrology and Earth System Sciences, Volume 25, Issue 9, pp 5287–5313.
[8] Leijnse, T., van Ormondt, M., Nederhoff, K., & van Dongeren, A. (2021). Modeling compound flooding in coastal systems using a computationally efficient reduced-physics solver: Including fluvial, pluvial, tidal, wind- and wave-driven processes. Coastal Engineering, 163, 103796. https://doi.org/10.1016/j.coastaleng.2020.103796
[10] https://essd.copernicus.org/articles/11/1515/2019/
[11] Lavers et al. 2022. “An evaluation of ERA5 precipitation for climate monitoring.” Quarterly Journal of the Royal Meteorological Society 148 (748): 3152-3165.