Logo

Harnessing the Climate Digital Twin for Wind Energy

Climate DT – User Story

Key users are at the heart of the Climate Change Adaptation Digital Twin (Climate DT). The Climate DT is part of the European Commission’s Destination Earth initiative, developed by CSC and leading institutions across Europe, together with ECMWF.  Through a co-design process, the Climate DT integrates tailored, user-oriented information for sectors affected by climate change, helping them address related challenges more effectively. One such sector is renewable energy, especially wind power, which is vital to Europe’s energy transition and highly sensitive to climate variability and change. 

The wind energy sector is expanding both onshore and offshore, driving a steady rise in energy production (Figure 1). This growth increases the demand for detailed and timely climate information tailored to guide adaptation in wind farm design and operations, as well as to identify suitable locations for new installations. It also creates a need for improved estimates of future wind energy resources to support long-term planning. 

The Climate DT’s new capabilities are key to meeting these needs, contributing to a stable energy supply while ensuring that infrastructure development aligns with broader sustainability goals. Its co-design approach actively involves end-users from the wind energy sector, fostering a close collaboration throughout the development.  

This article explores how these capabilities can provide targeted solutions for the wind energy sector, supporting the planning of a climate-resilient energy system that advances the EU’s broader climate and energy goals. 
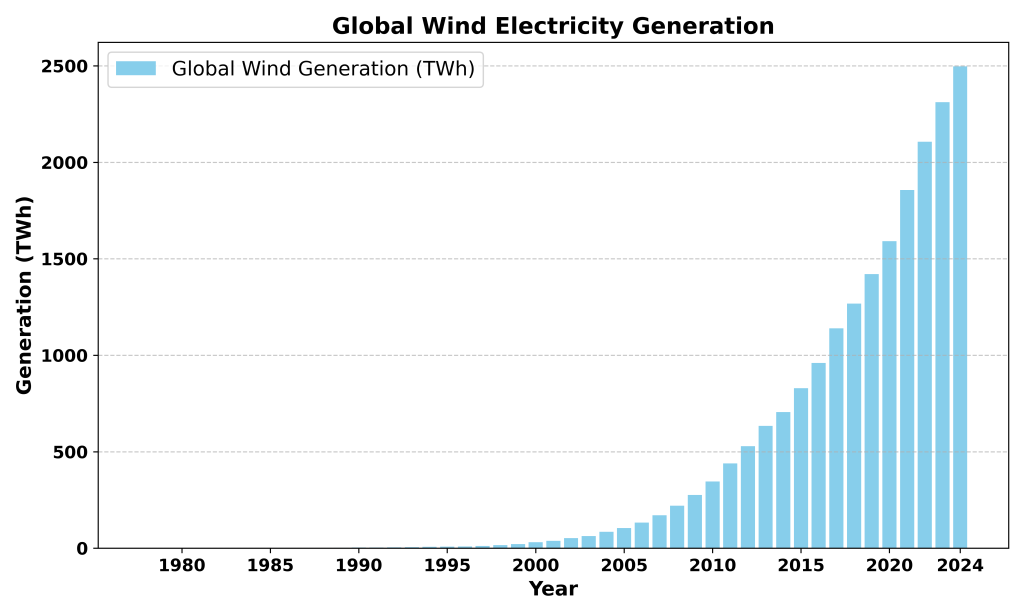
Figure 1. Source: Ember (2025); Energy Institute - Statistical Review of World Energy (2024)

1. Wind energy and the role of climate data

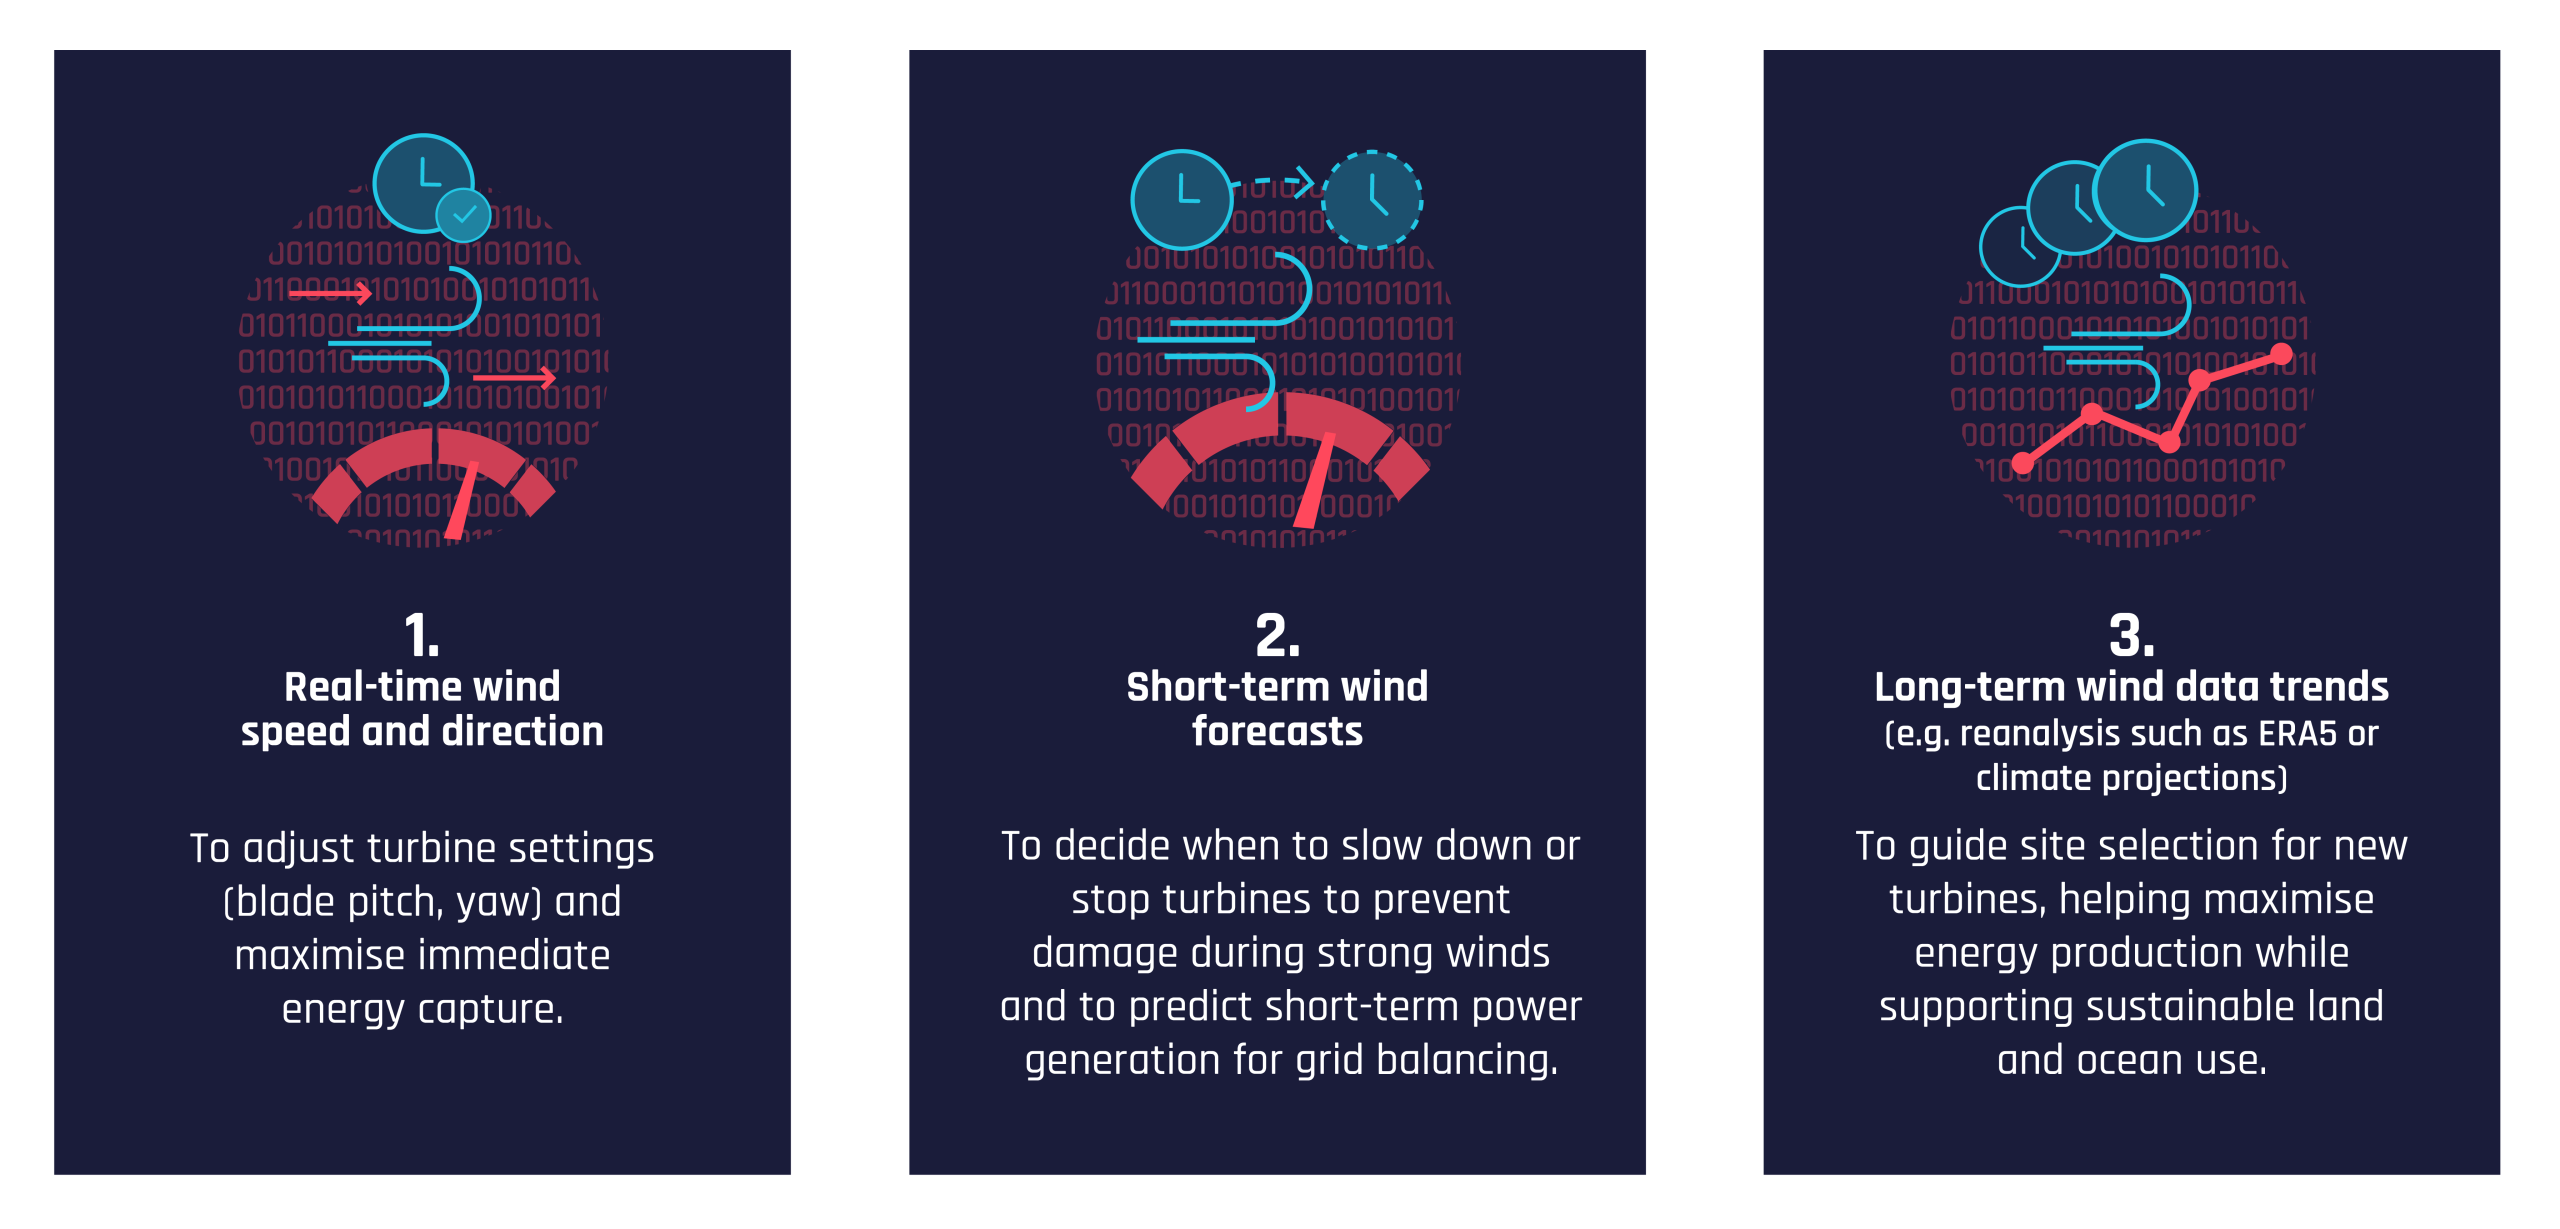
Wind farms generate electricity by converting wind energy into power through turbines installed at carefully selected sites. Developers, operators and owners rely on a range of weather and climate data to inform decisions throughout a wind farm’s lifecycle, from site selection and planning, to optimising energy production and maintaining turbine condition (see Table 1.). 

Table 1. Data types for wind energy decisions

2. Tailored Climate DT information for wind energy

2.1. Working with users

The Climate DT consortium works in close collaboration with specific users in the renewables sector, incorporating their input throughout the design process. These users provide continuous feedback on critical aspects such as the data portfolio, software optimisation, and data strategy, ensuring the system meets sector-specific needs. This co-design process enables the creation of targeted  sectoral applications, such as the wind energy application described here, which are fully integrated in the Climate DT system, alongside the multi-decadal climate simulations.  

Watch this video-interview with Roberto Chavez from Ocean Winds, sharing his experience as part of a user testimonial for the Climate DT.  

2.2. A flexible workflow

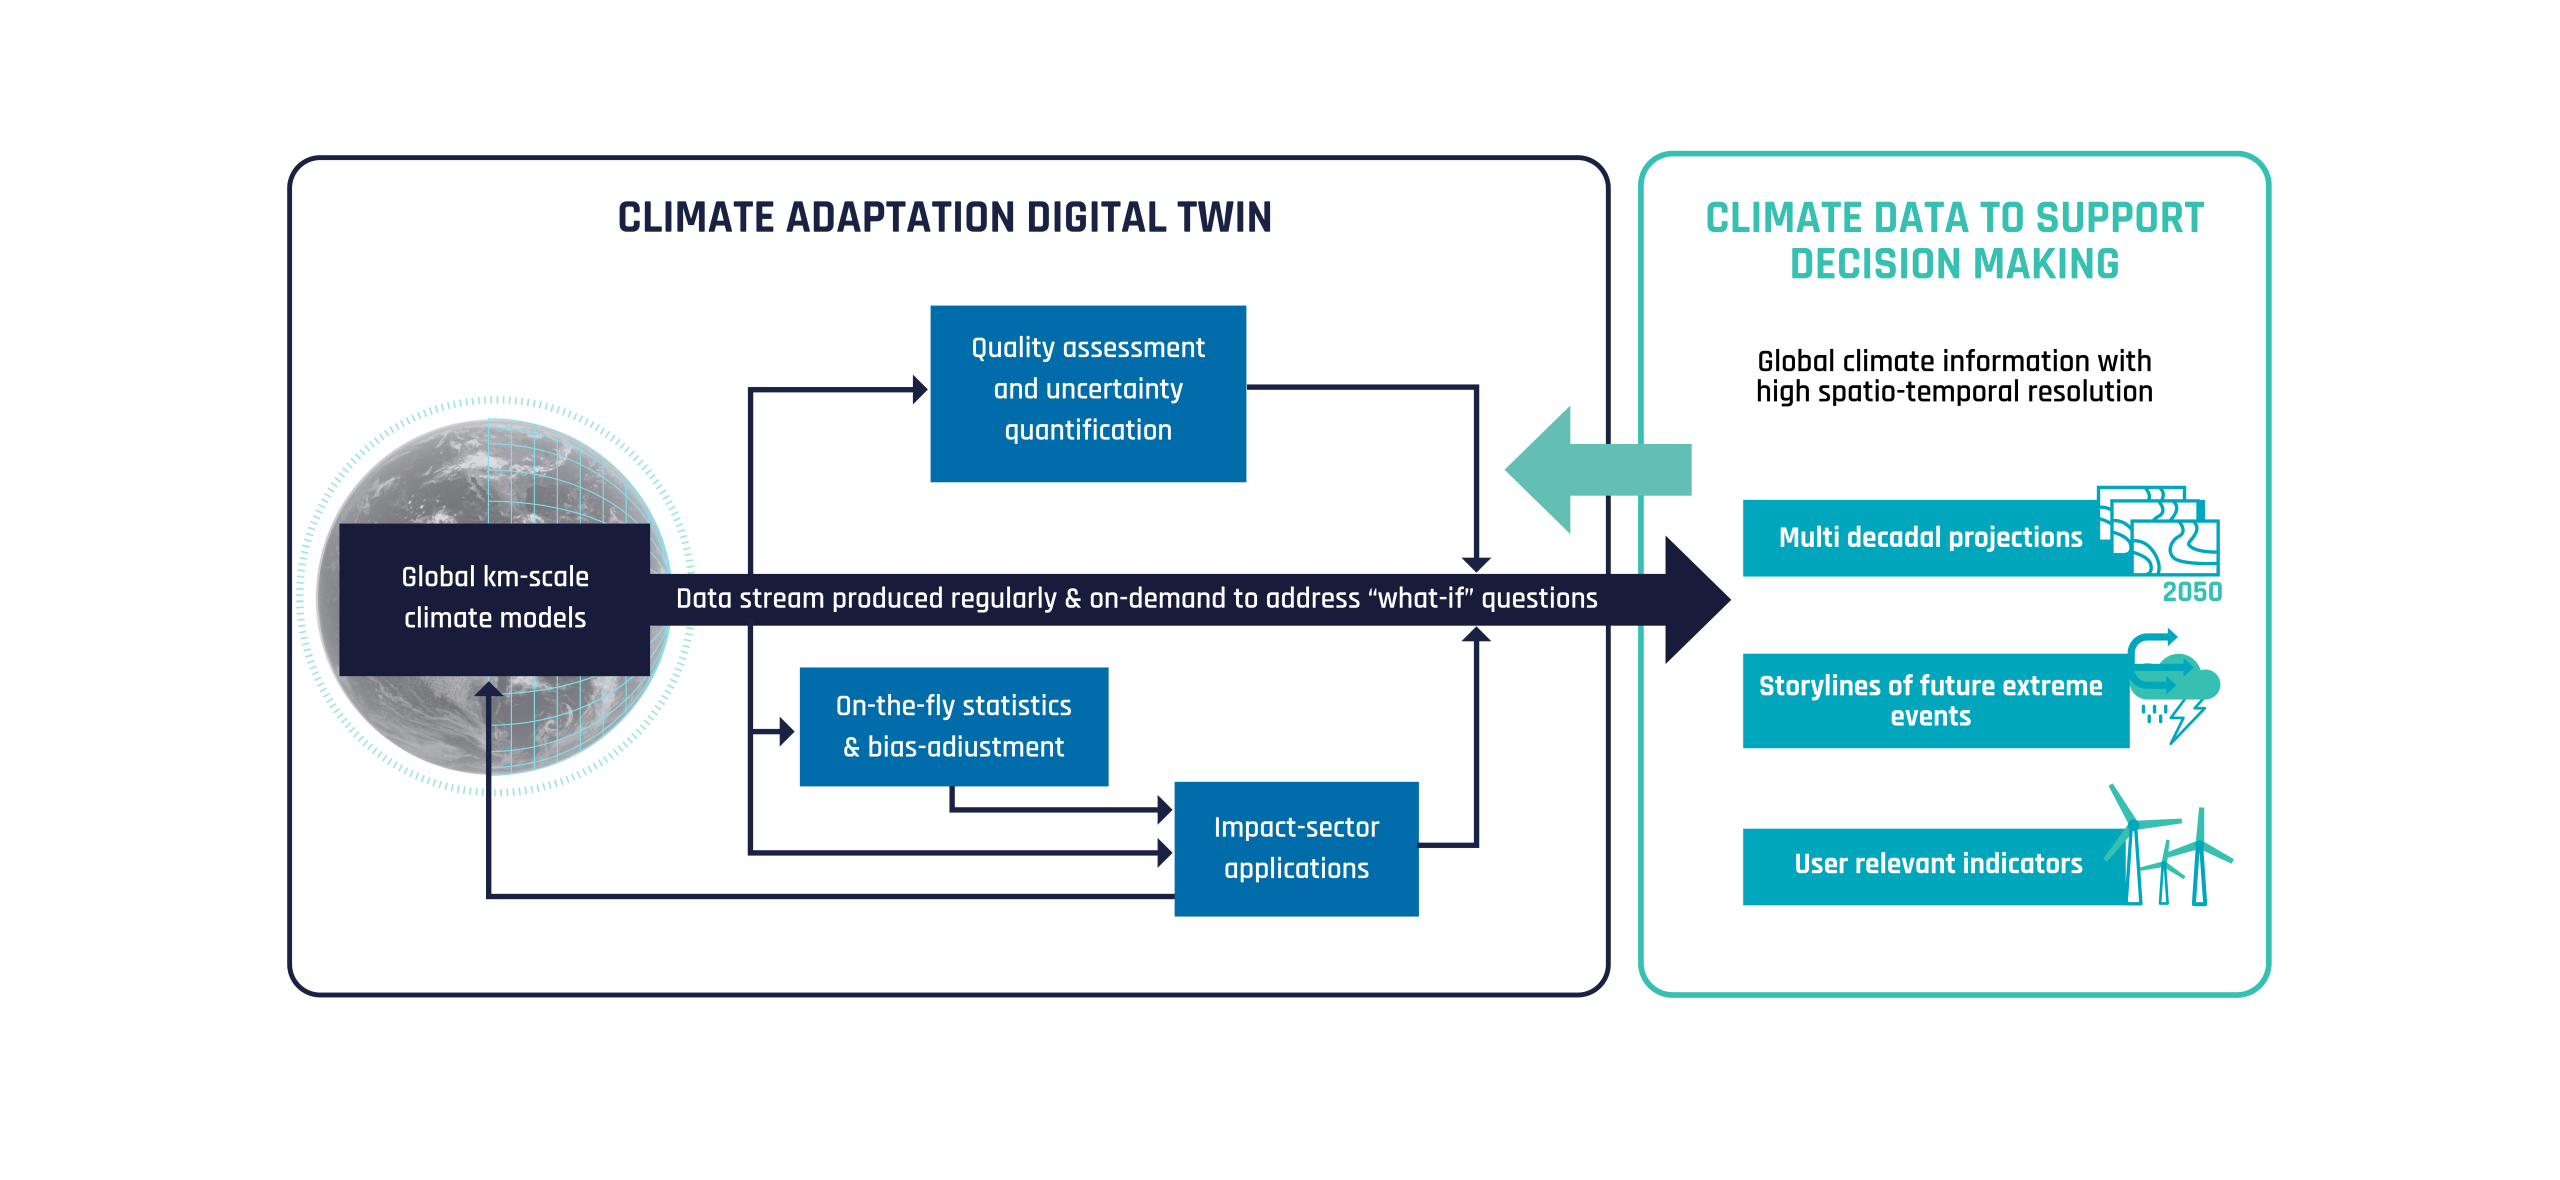
The integration of sectoral applications into the ClimateDT is enabled by its flexible workflow, which allows them to run alongside kilometre-scale Global Climate models and process streamed climate data, with high spatial and temporal resolution, as is produced. 

2.3. Wind energy indicators in the Climate DT

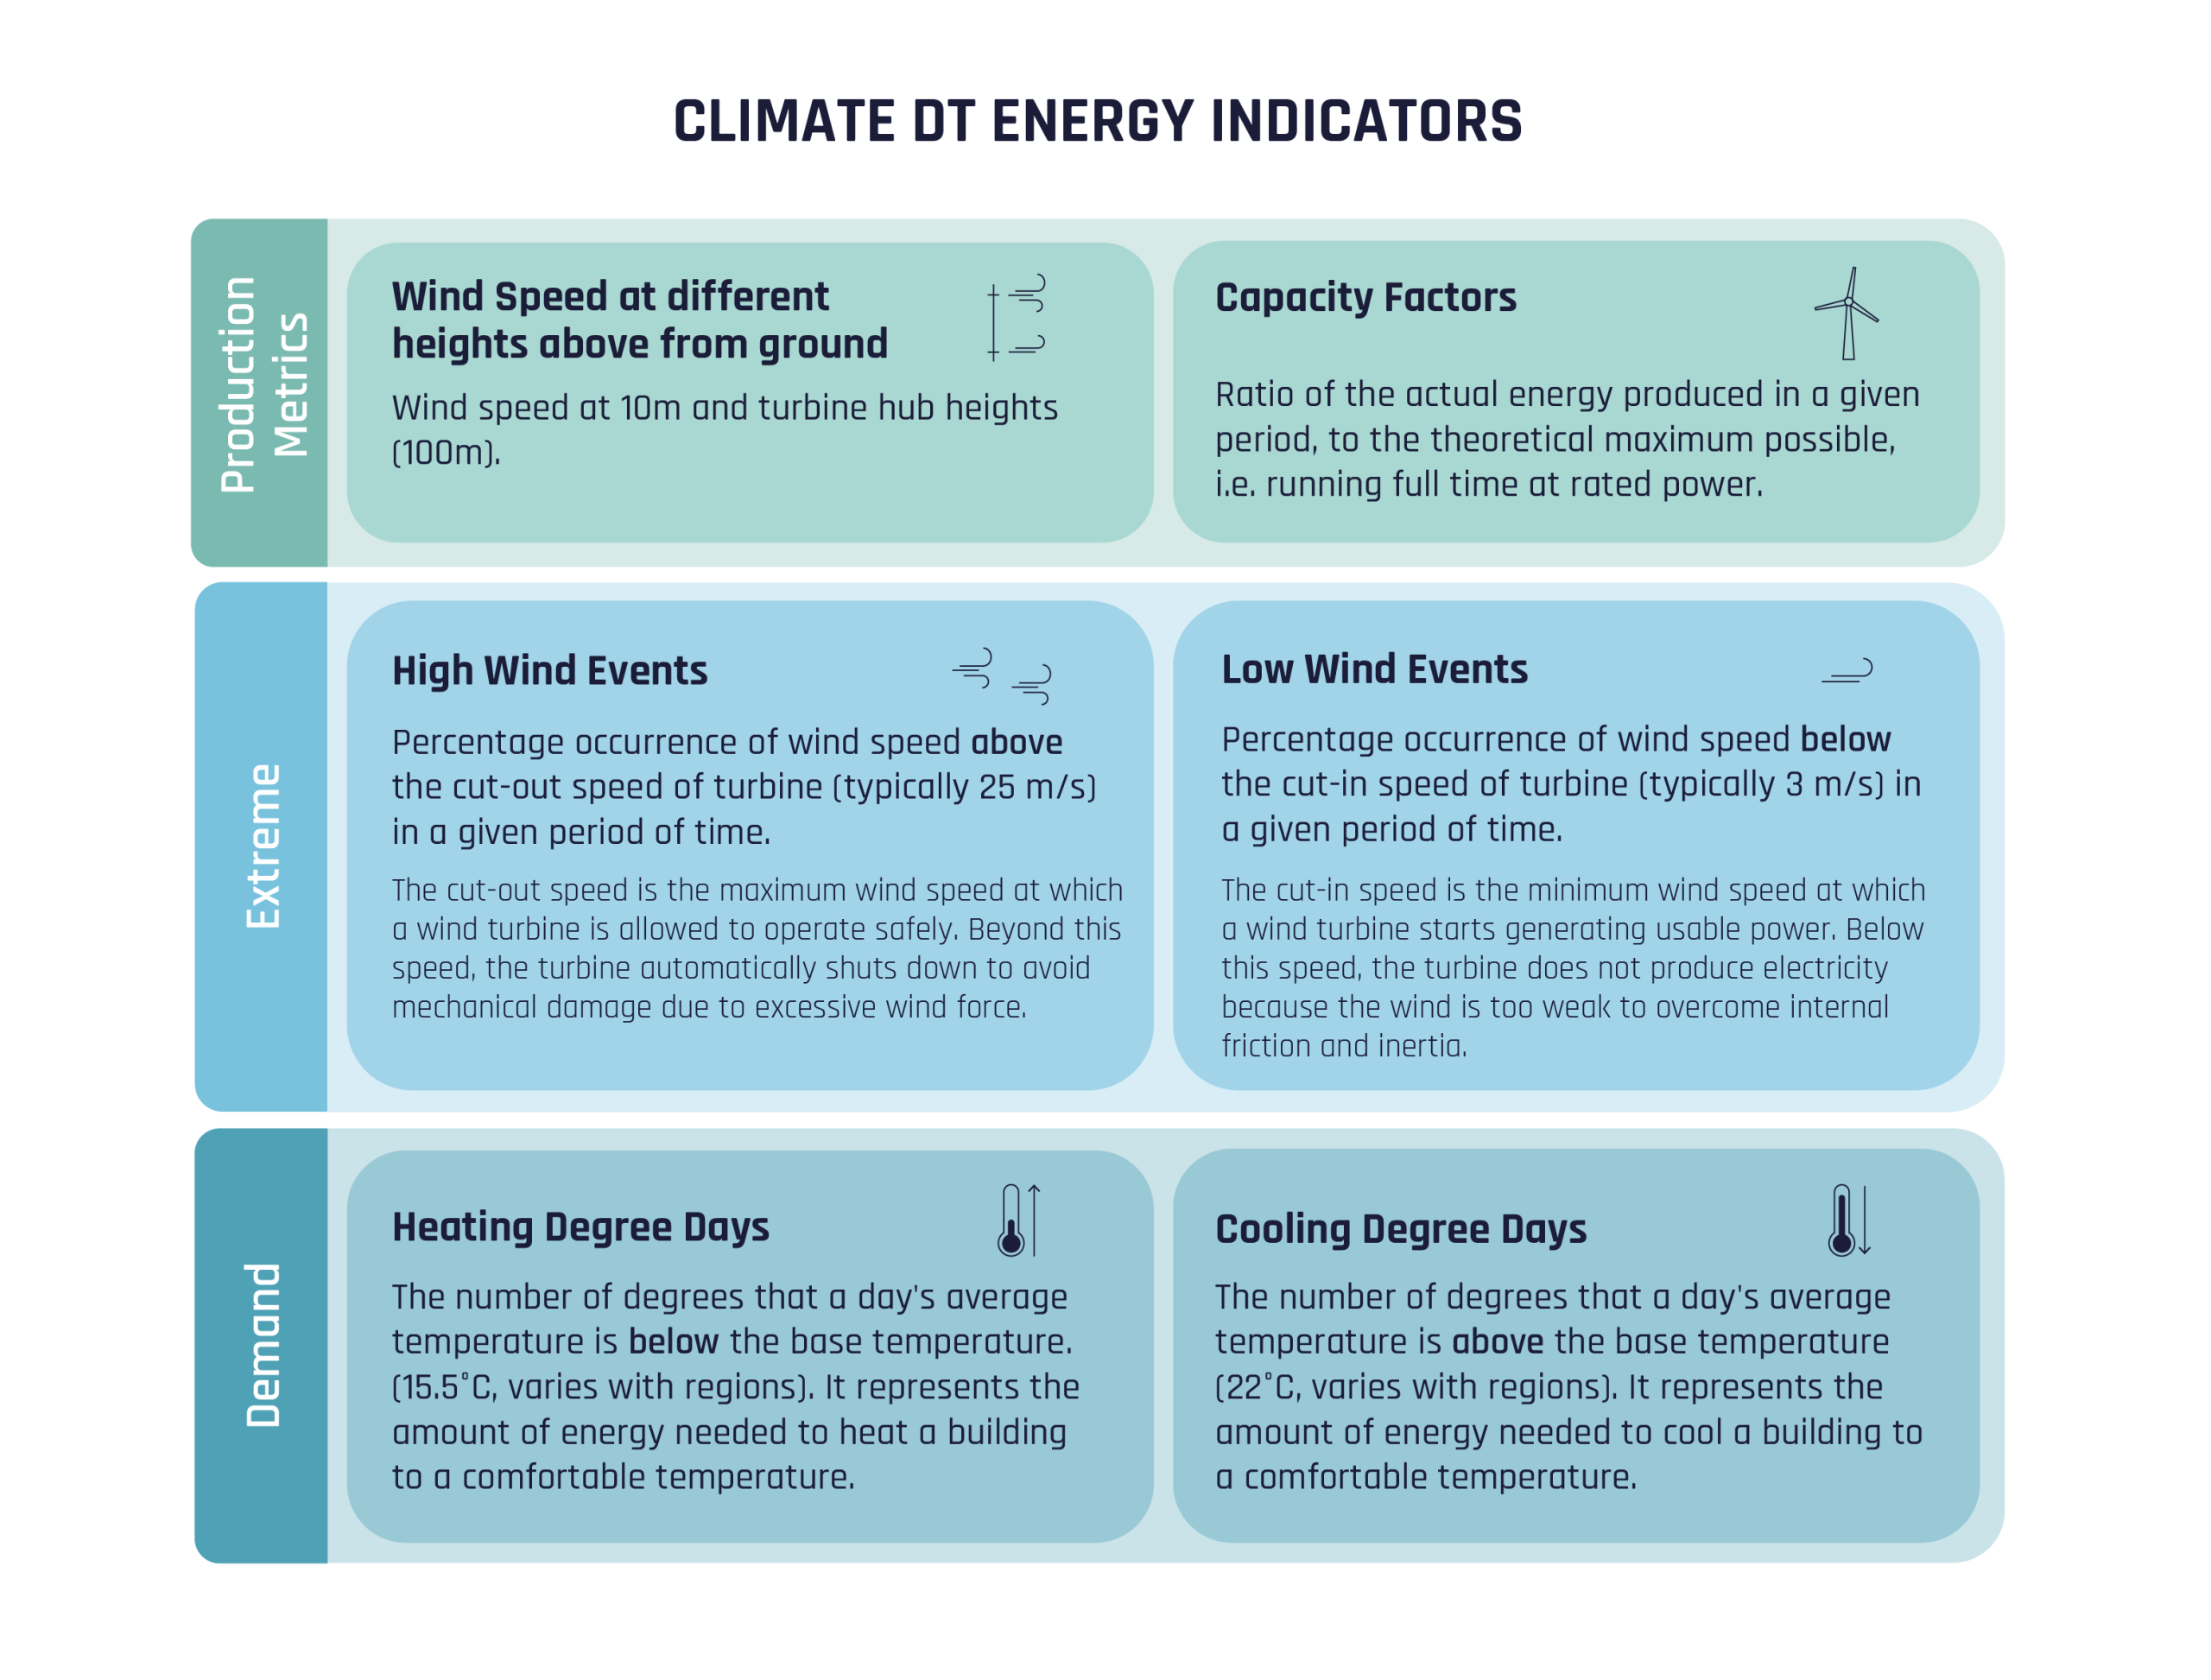
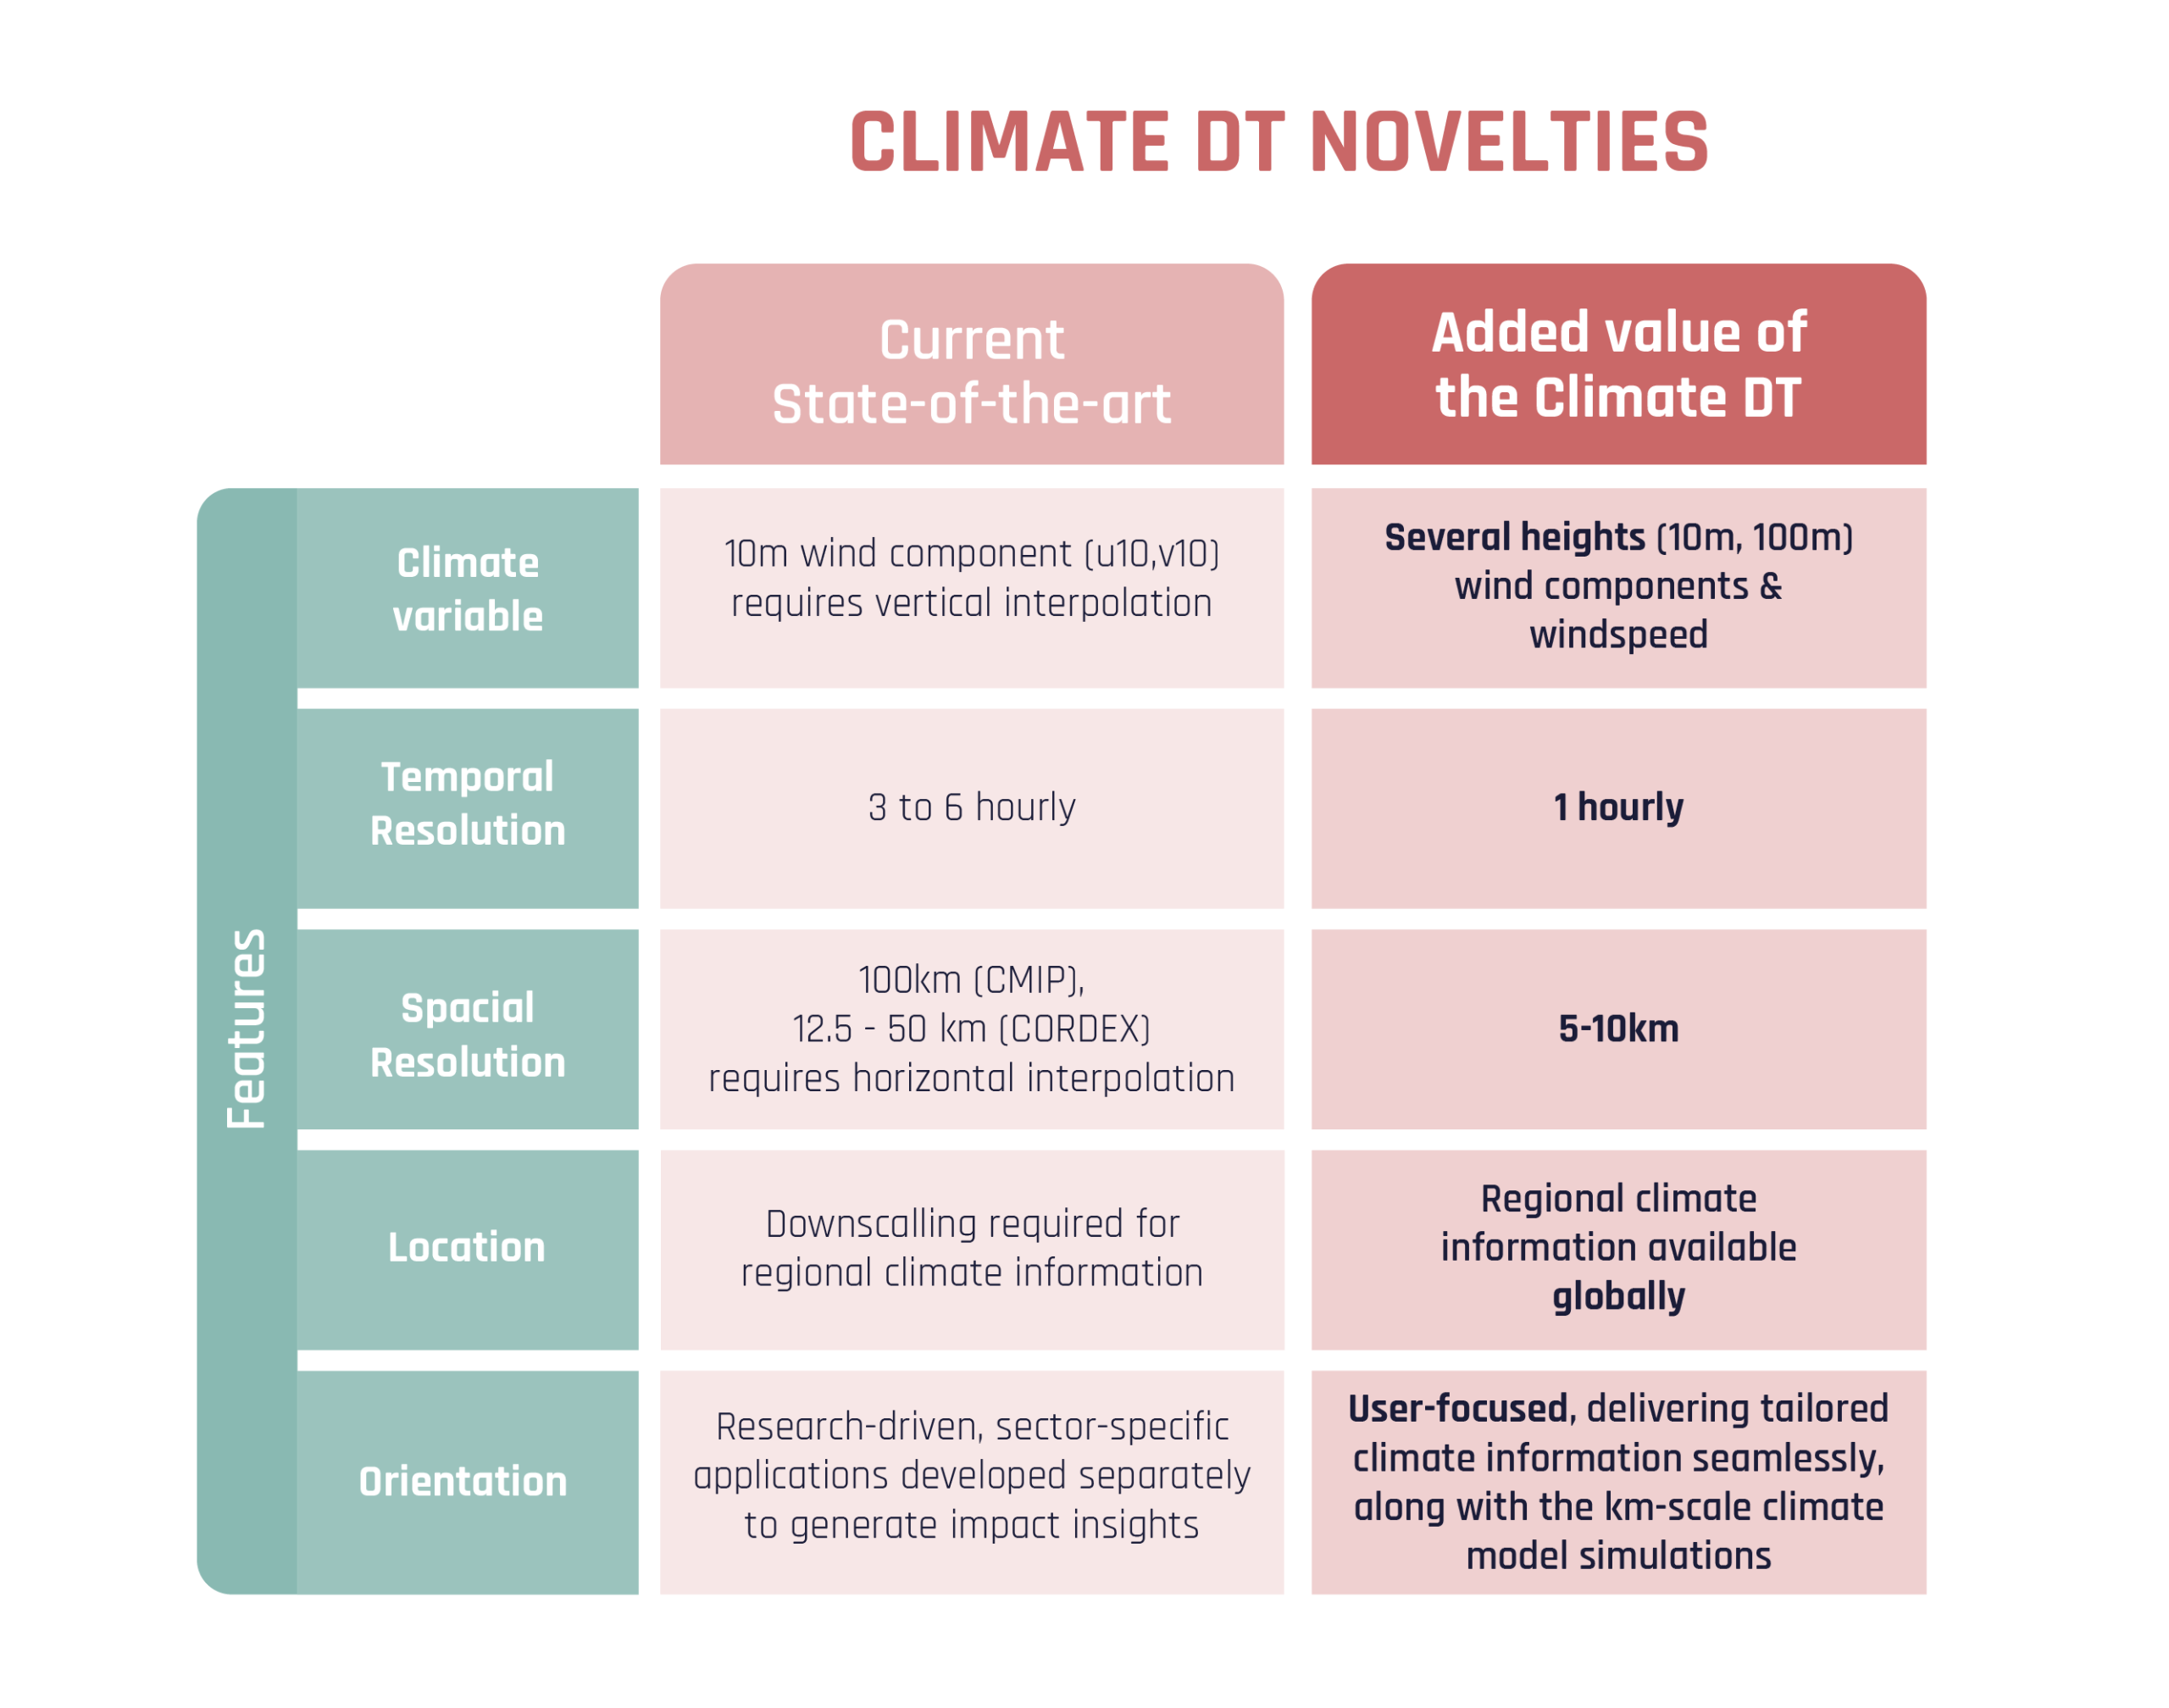
The Climate DT wind energy application transforms km-scale global climate data into tailored information for the wind energy sector, covering various temporal and spatial scales.  It provides both relevant atmospheric variables, such as wind speed at various heights, and a set of indicators developed in collaboration with industry experts specialising in wind resource assessment and planning. For example, unlike most climate models that provide wind speed at only 10m, the Climate DT also provides wind speed at 100m, a typical turbine hub height. Both the raw climate variables and the derived indicators are available globally, with local detail (5 10 km), and hourly temporal resolution, representing a major advance over existing global climate simulations (~100 km, 3-6 hourly resolutions). 

SECTORAL INDICATORS

Indicators are metrics derived from atmospheric variables that help quantify the impact of weather and climate on wind energy production and operations. These include  measures of wind power generation potential, as well as operational constraints, such as conditions that trigger turbine shutdowns.  

CAPACITY FACTOR

The capacity factor is one such specific metric. It measures how much energy a wind turbine produces compared to its maximum possible output if operated at full capacity continuously. For example, a turbine capable of generating 100 units of energy nonstop but producing 30 units in reality would have a capacity factor of 30%. This metric helps assess turbine performance and estimate energy yield over time. 

 A range of indicators relevant to energy production, such as the capacity factor, is computed for every grid point of the climate simulations, both offshore and onshore.  

In addition, the energy application calculates specialised indicators for offshore locations, supporting the construction, operation, and maintenance of wind farms at sea. These include metrics for sea spray icing, sea ice, ice-induced structural stress, and expected navigability, all of which are critical for ensuring safe and reliable offshore operations.  

This video, created by the Barcelona Supercomputing Center, visualises specific energy indicators produced by the Climate DT.

3. Addressing wind energy challenges

3.1. The need for global coverage for long-term planning

Current and future wind resource estimates rely on global reanalysis data like the C3S ERA5 (~30 km resolution) and CMIP climate projections (~100 km), with various downscaling methods applied to refine them. However, these approaches lack a unified global approach that provides consistent information across all regions and often do not fully account for climate change-driven shifts in weather patterns. 

The multi-decadal simulations of the Climate DT can help overcome some of these gaps by providing globally consistent, km-scale projections of future wind conditions. This enables more detailed assessments of climate-driven changes in wind resources and extremes, supporting informed long-term planning for site selection, infrastructure resilience, sustainable land and ocean use and grid stability as the energy system transitions. 

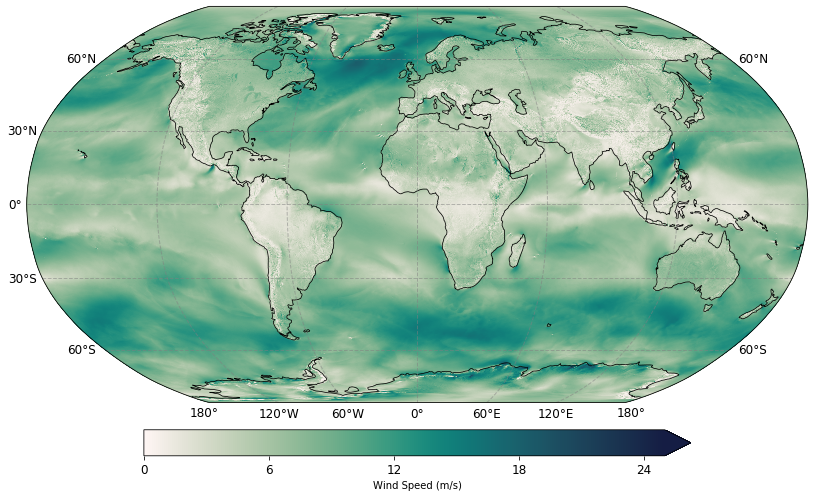
Figure 2. Wind speed at 100m averaged over one week from 1-hourly wind components (100u, 100v). Data was obtained from the ClimateDT IFS-NEMO historical simulation.
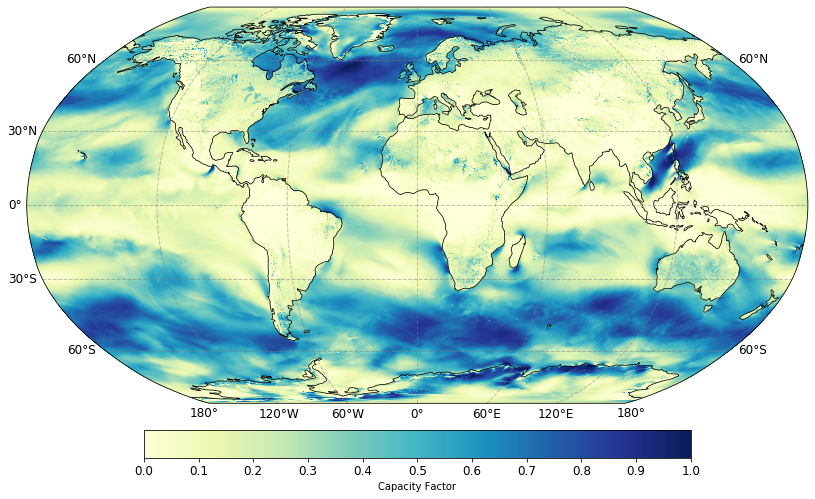
Figure 3. Capacity factor at 100m hub height for a class S Vestas V164 wind turbine, averaged over one week and computed from 1-hourly wind components (100u, 100v). Data was obtained from the ClimateDT IFS-NEMO historical simulation.
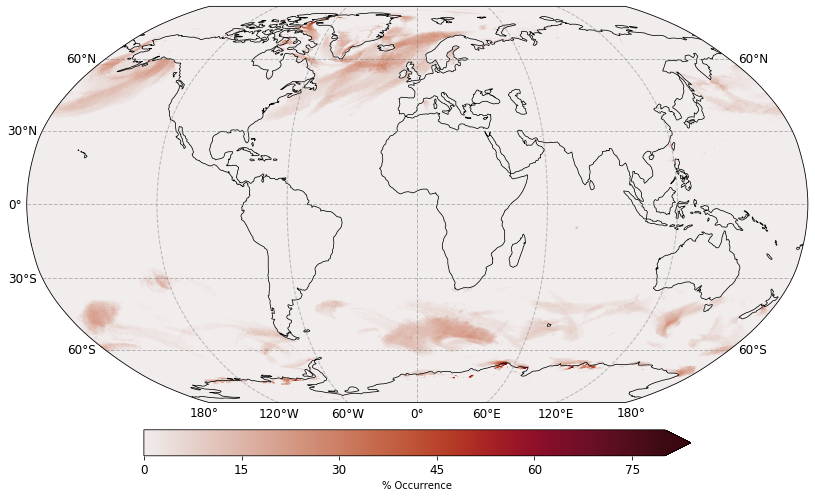
Figure 4. Percentage occurrence of Low Wind Events (LWE) at 100m accumulated over one week from 1-hourly wind components (100u, 100v). Data was obtained from the ClimateDT IFS-NEMO historical simulation. The threshold for LWE: Wind Speed below 3m/s.
Figure 5. Percentage occurrence of High Wind Events (HWE) at 100m accumulated over one week from 1-hourly wind components (100u, 100v). Data was obtained from the ClimateDT IFS-NEMO historical simulation. The threshold for HWE: Wind Speed above 25m/s.

3.2. Capturing wind variability: the need for high-frequency data

Most existing climate projections are aggregated into daily or monthly averages, limiting their ability to inform on fluctuations that significantly influence power generation. The Climate DT overcomes this limitation by providing hourly output on multi-decadal timescales. This level of detail supports more robust estimates of wind energy potential, as hourly data can better capture the variability that affects generation and grid integration. 

3.3. Tailored climate indicators driving wind energy decisions

Even when climate data is available, it often lacks the tailored indicators needed by wind energy planners and operators. Indicators, such as the high wind events or capacity factors, computed in the Climate DT energy application, are necessary for site evaluation, performance estimates, and grid integration strategies. Without these sector-relevant outputs, translating climate information into actionable decisions remains a challenge. The Climate DT ensures these tailored indicators are included in its workflow. Its flexible design also allows other indicators to be added in future simulations cycles, enabling a user-driven co-design process. 

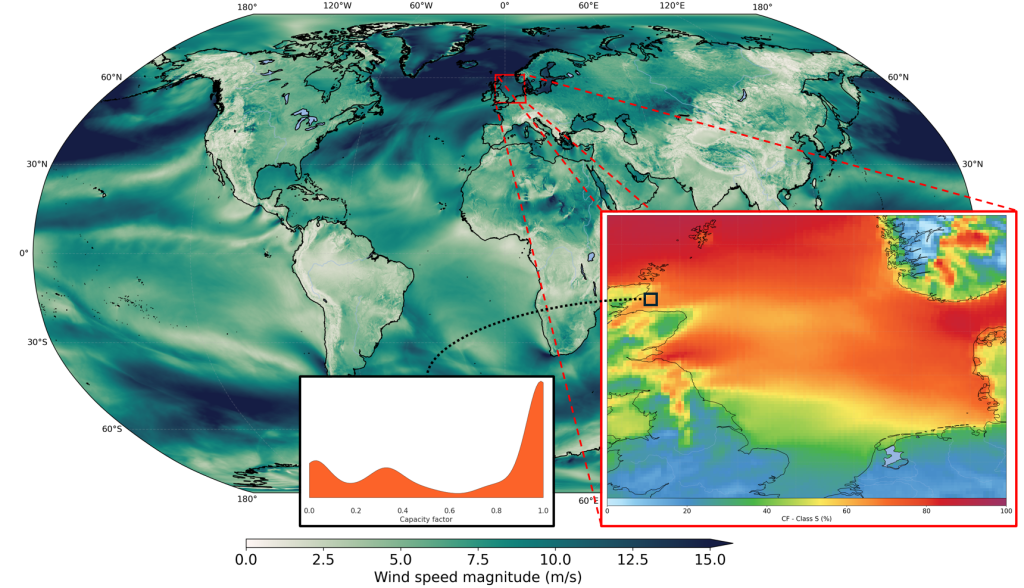
Figure 6: Global map with a snapshot of wind speed at 100 metres from the 10-km IFS-NEMO historical simulation. The regional zoom, highlighted with a red rectangle, shows the capacity factor averaged over a week for a class S Vestas V164 wind turbine over the North Sea computed from 1-hourly wind components (zonal and meridional 100-metre wind). The curve represents the distribution of the hourly capacity factor for Moray East during the week. The black square marks the location of the Moray East wind farm, off the coast of Scotland, which operates this specific type of turbine. Source: Doblas-Reyes et al. (2025).

4. A practical use of the Climate DT’s energy indicators

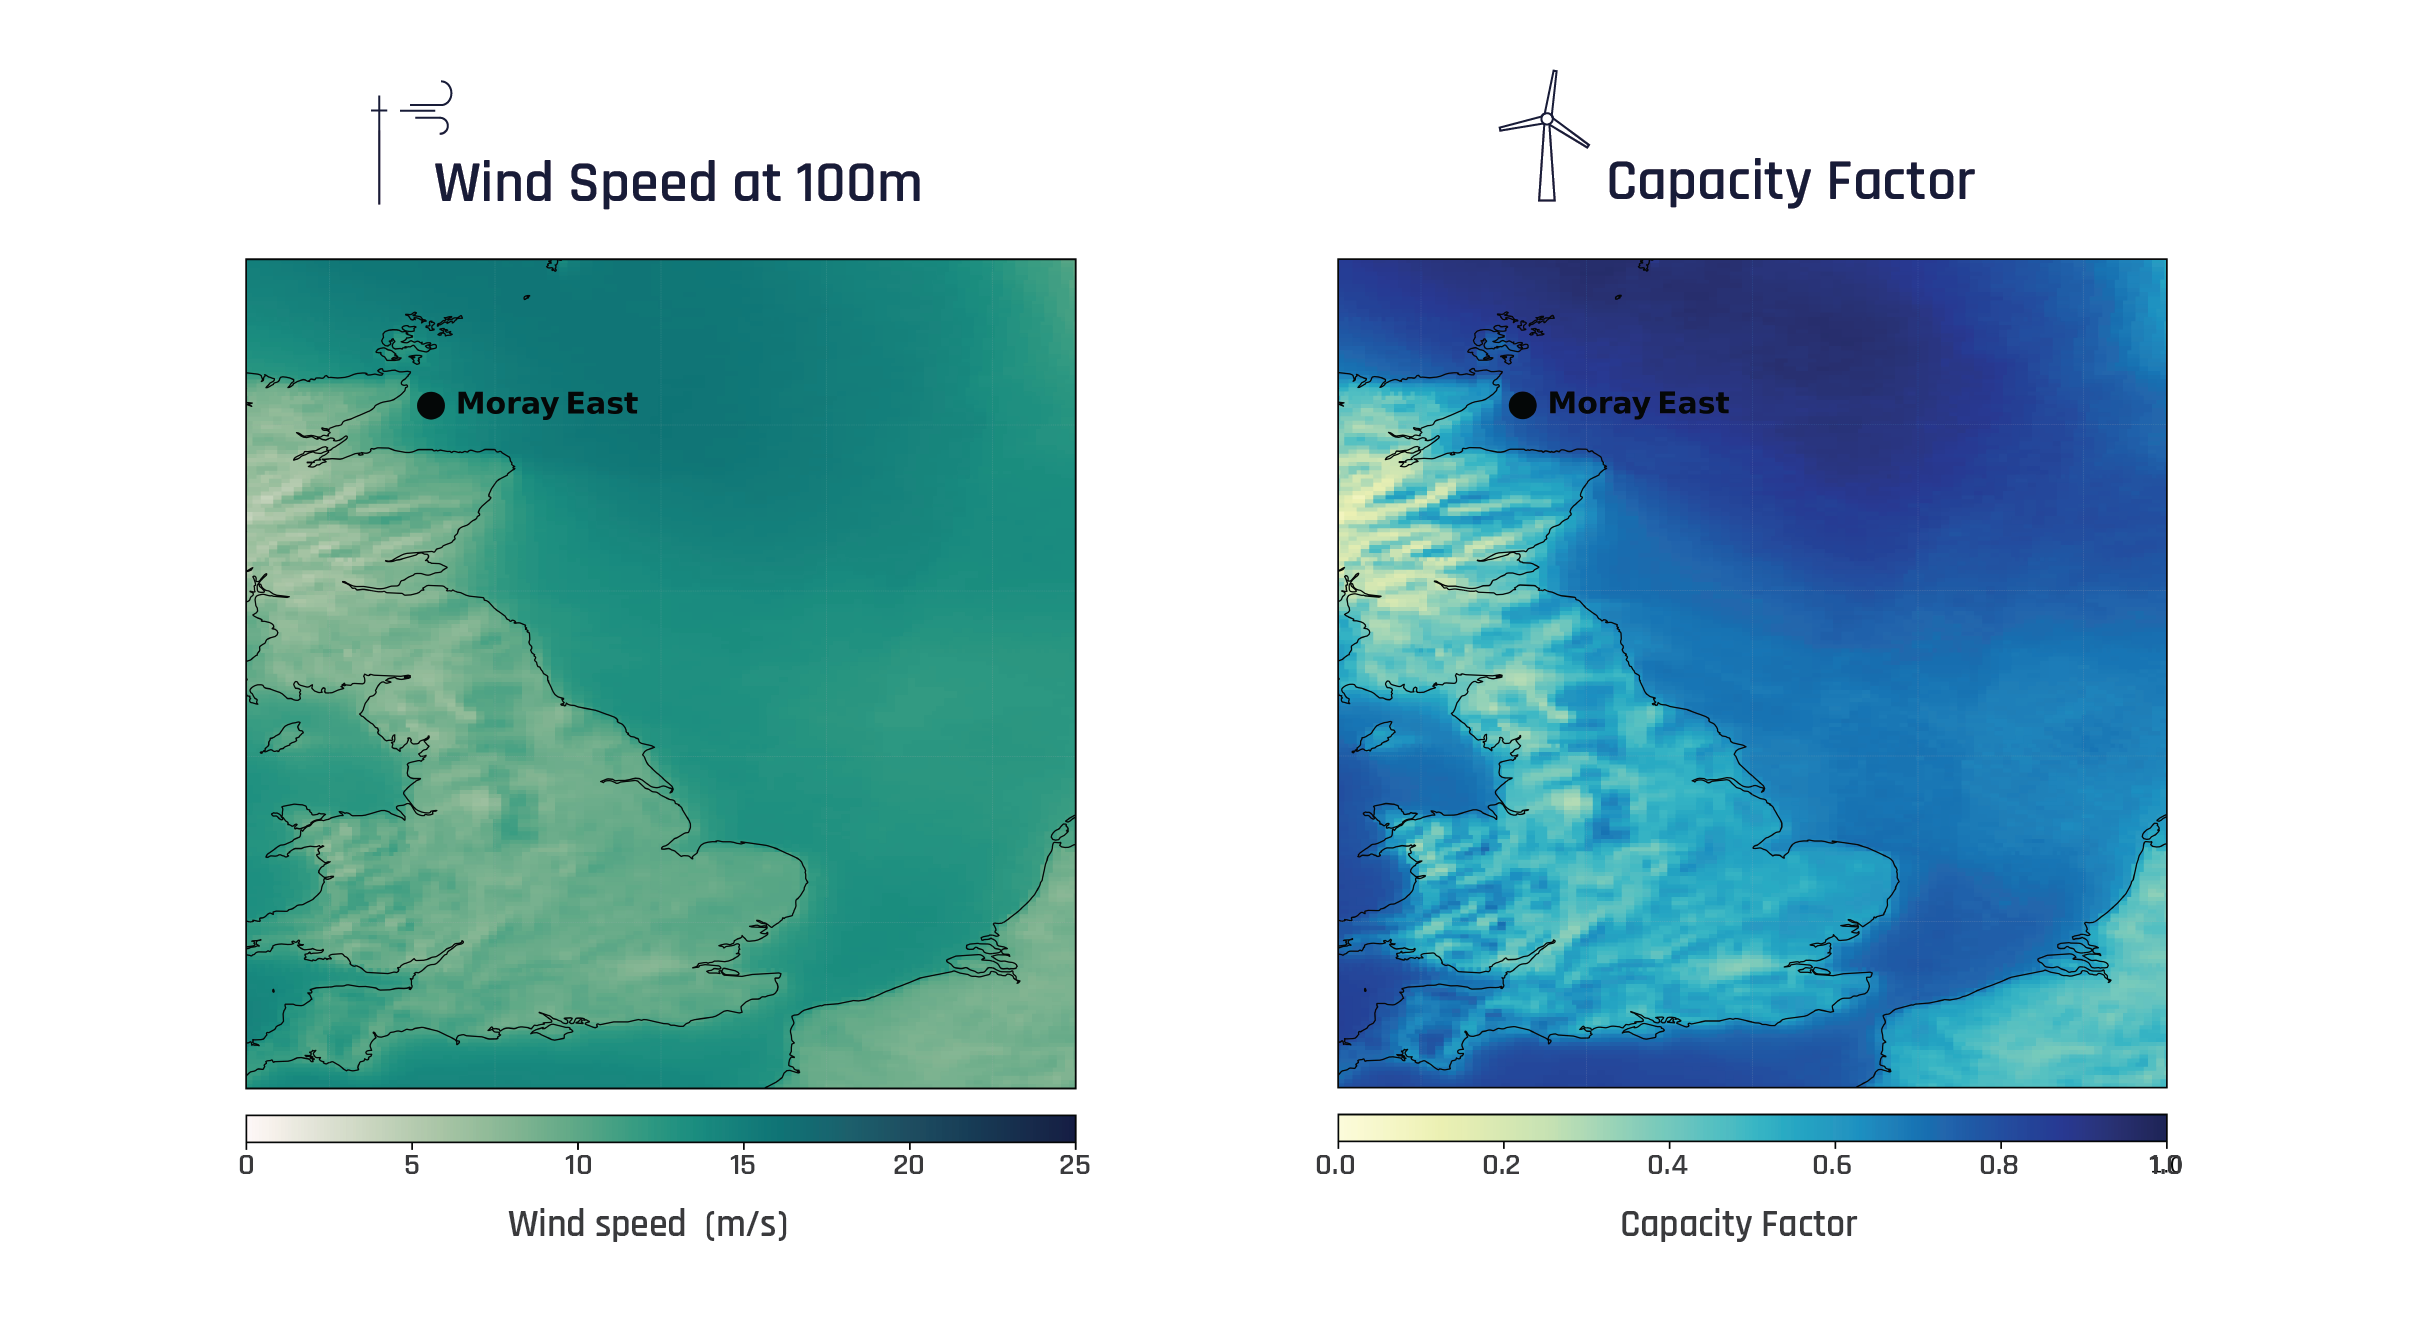
Figure 7. Wind speed at 100m (Left) over North Sea (a potential wind resource zone). The black dot shows the operational wind farm of Ocean Winds (key-user). Capacity factor at 100m hub height (Right) over North Sea.

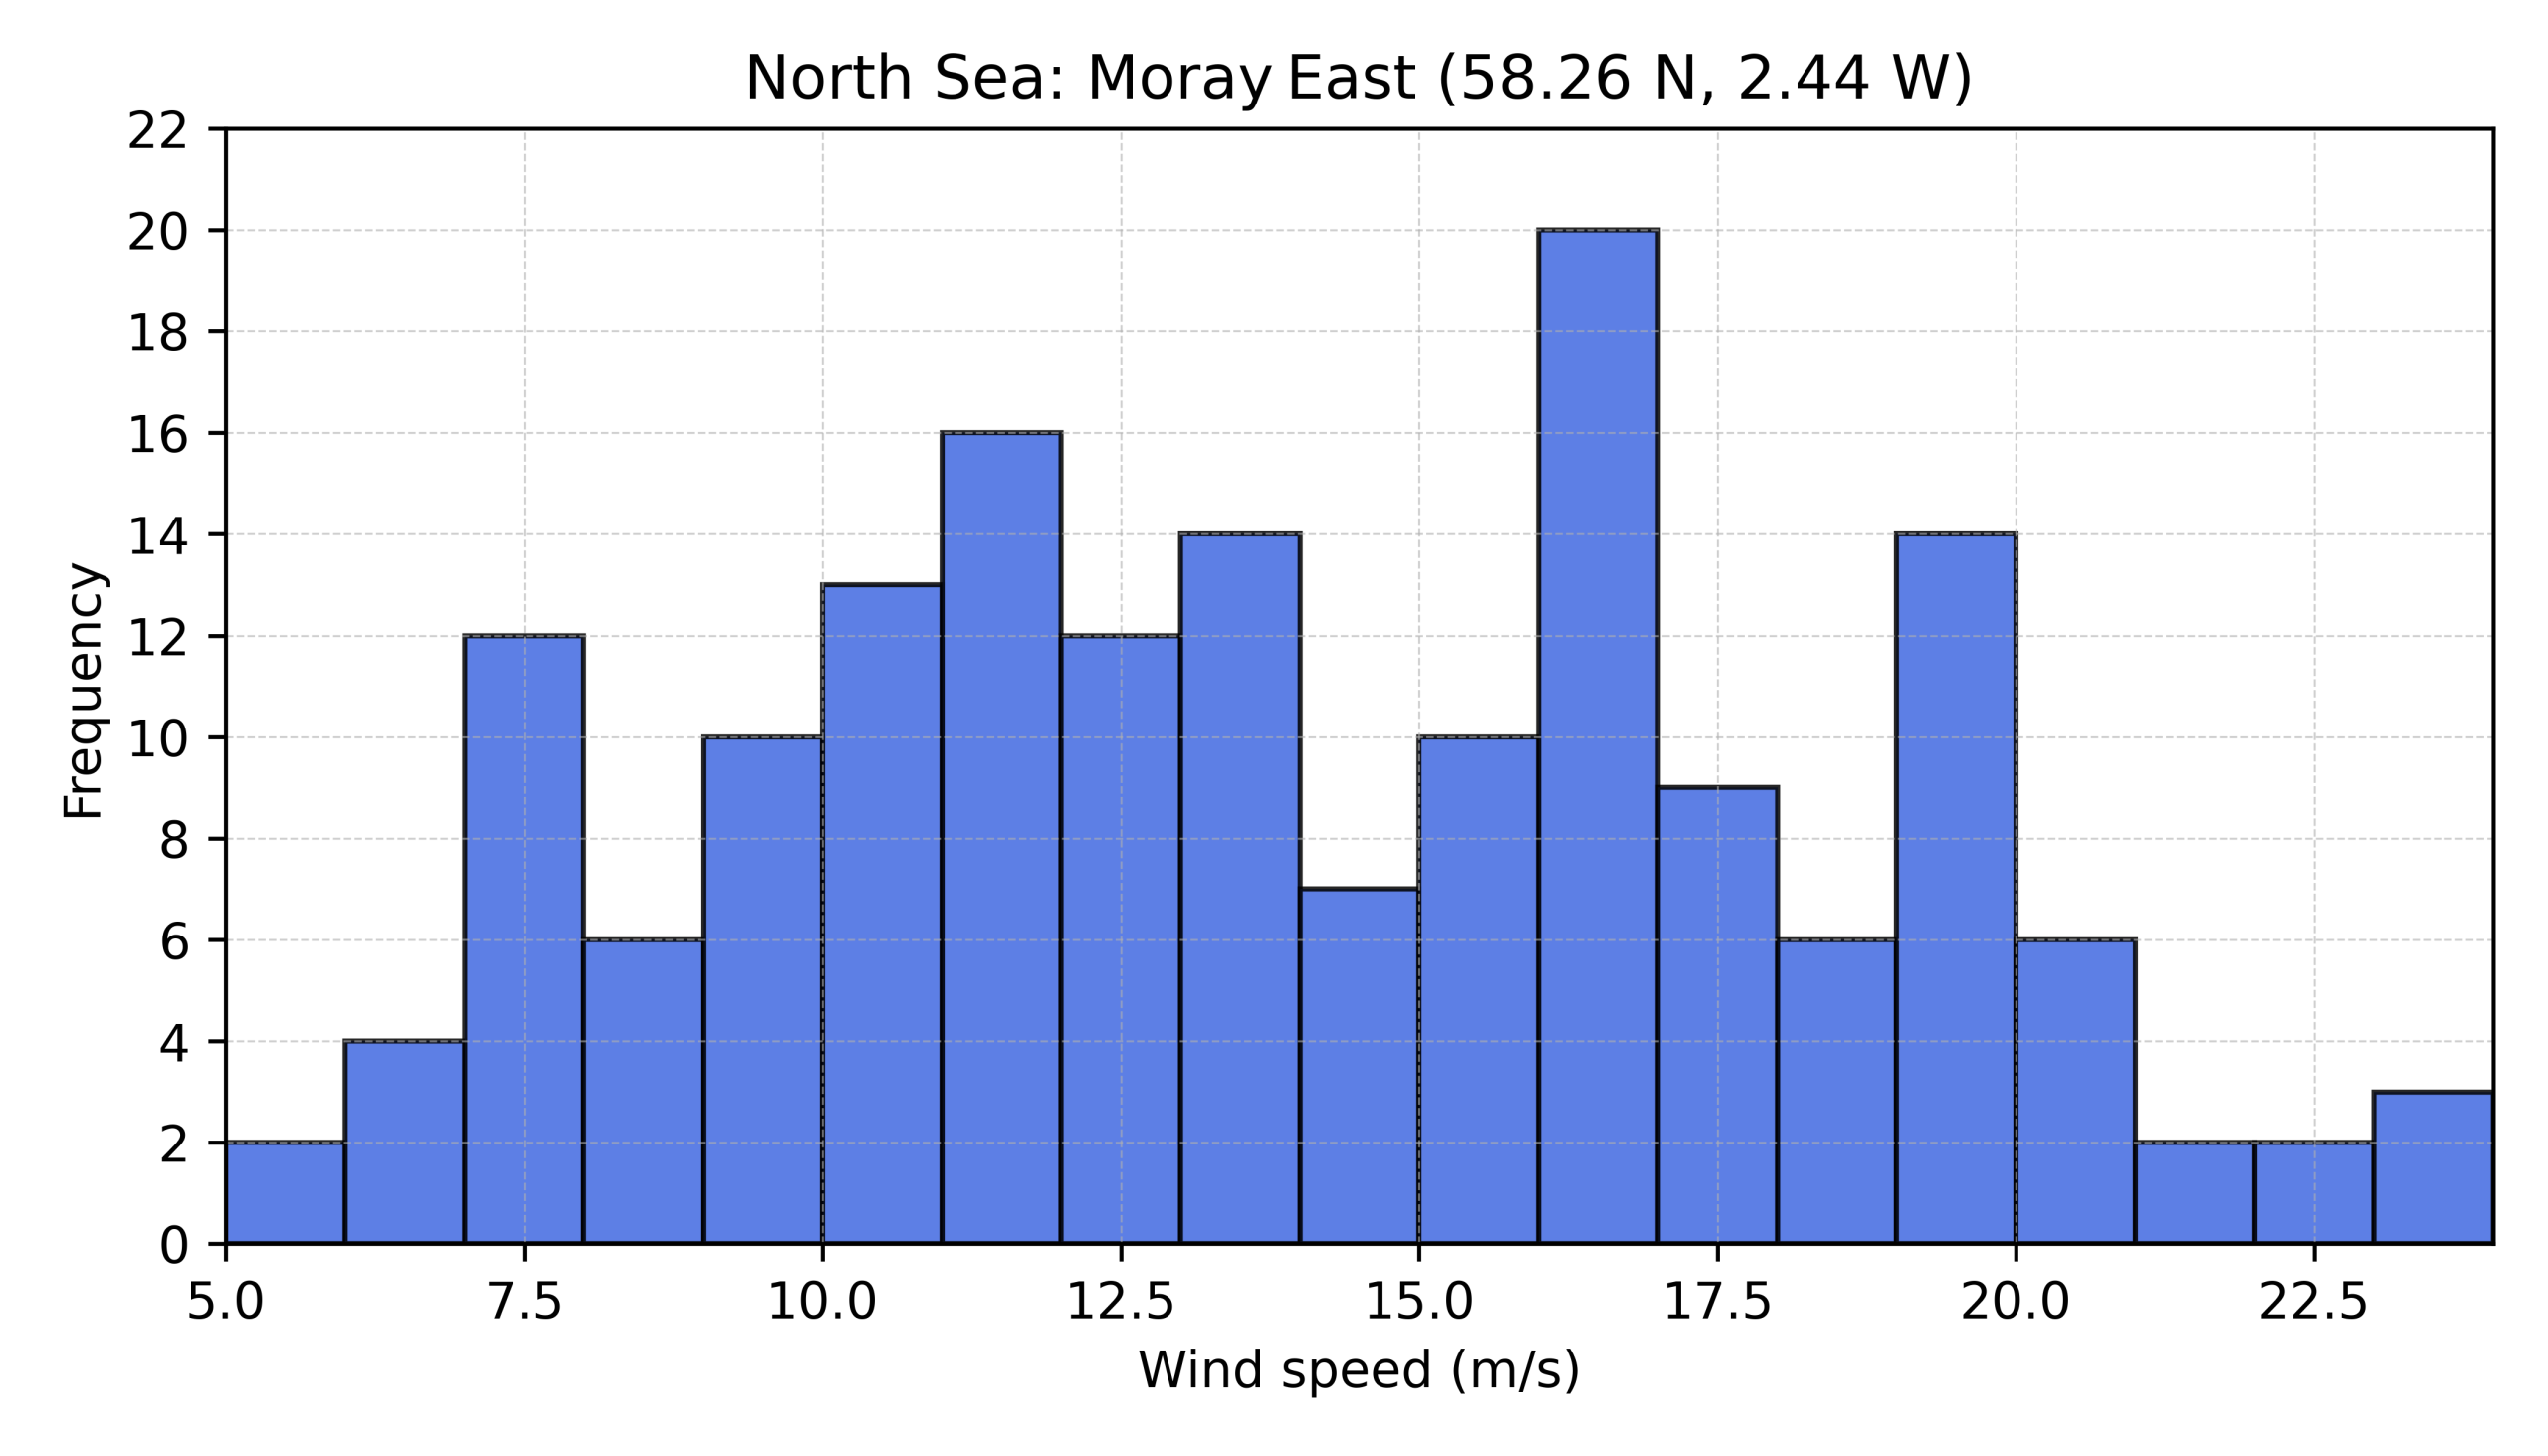
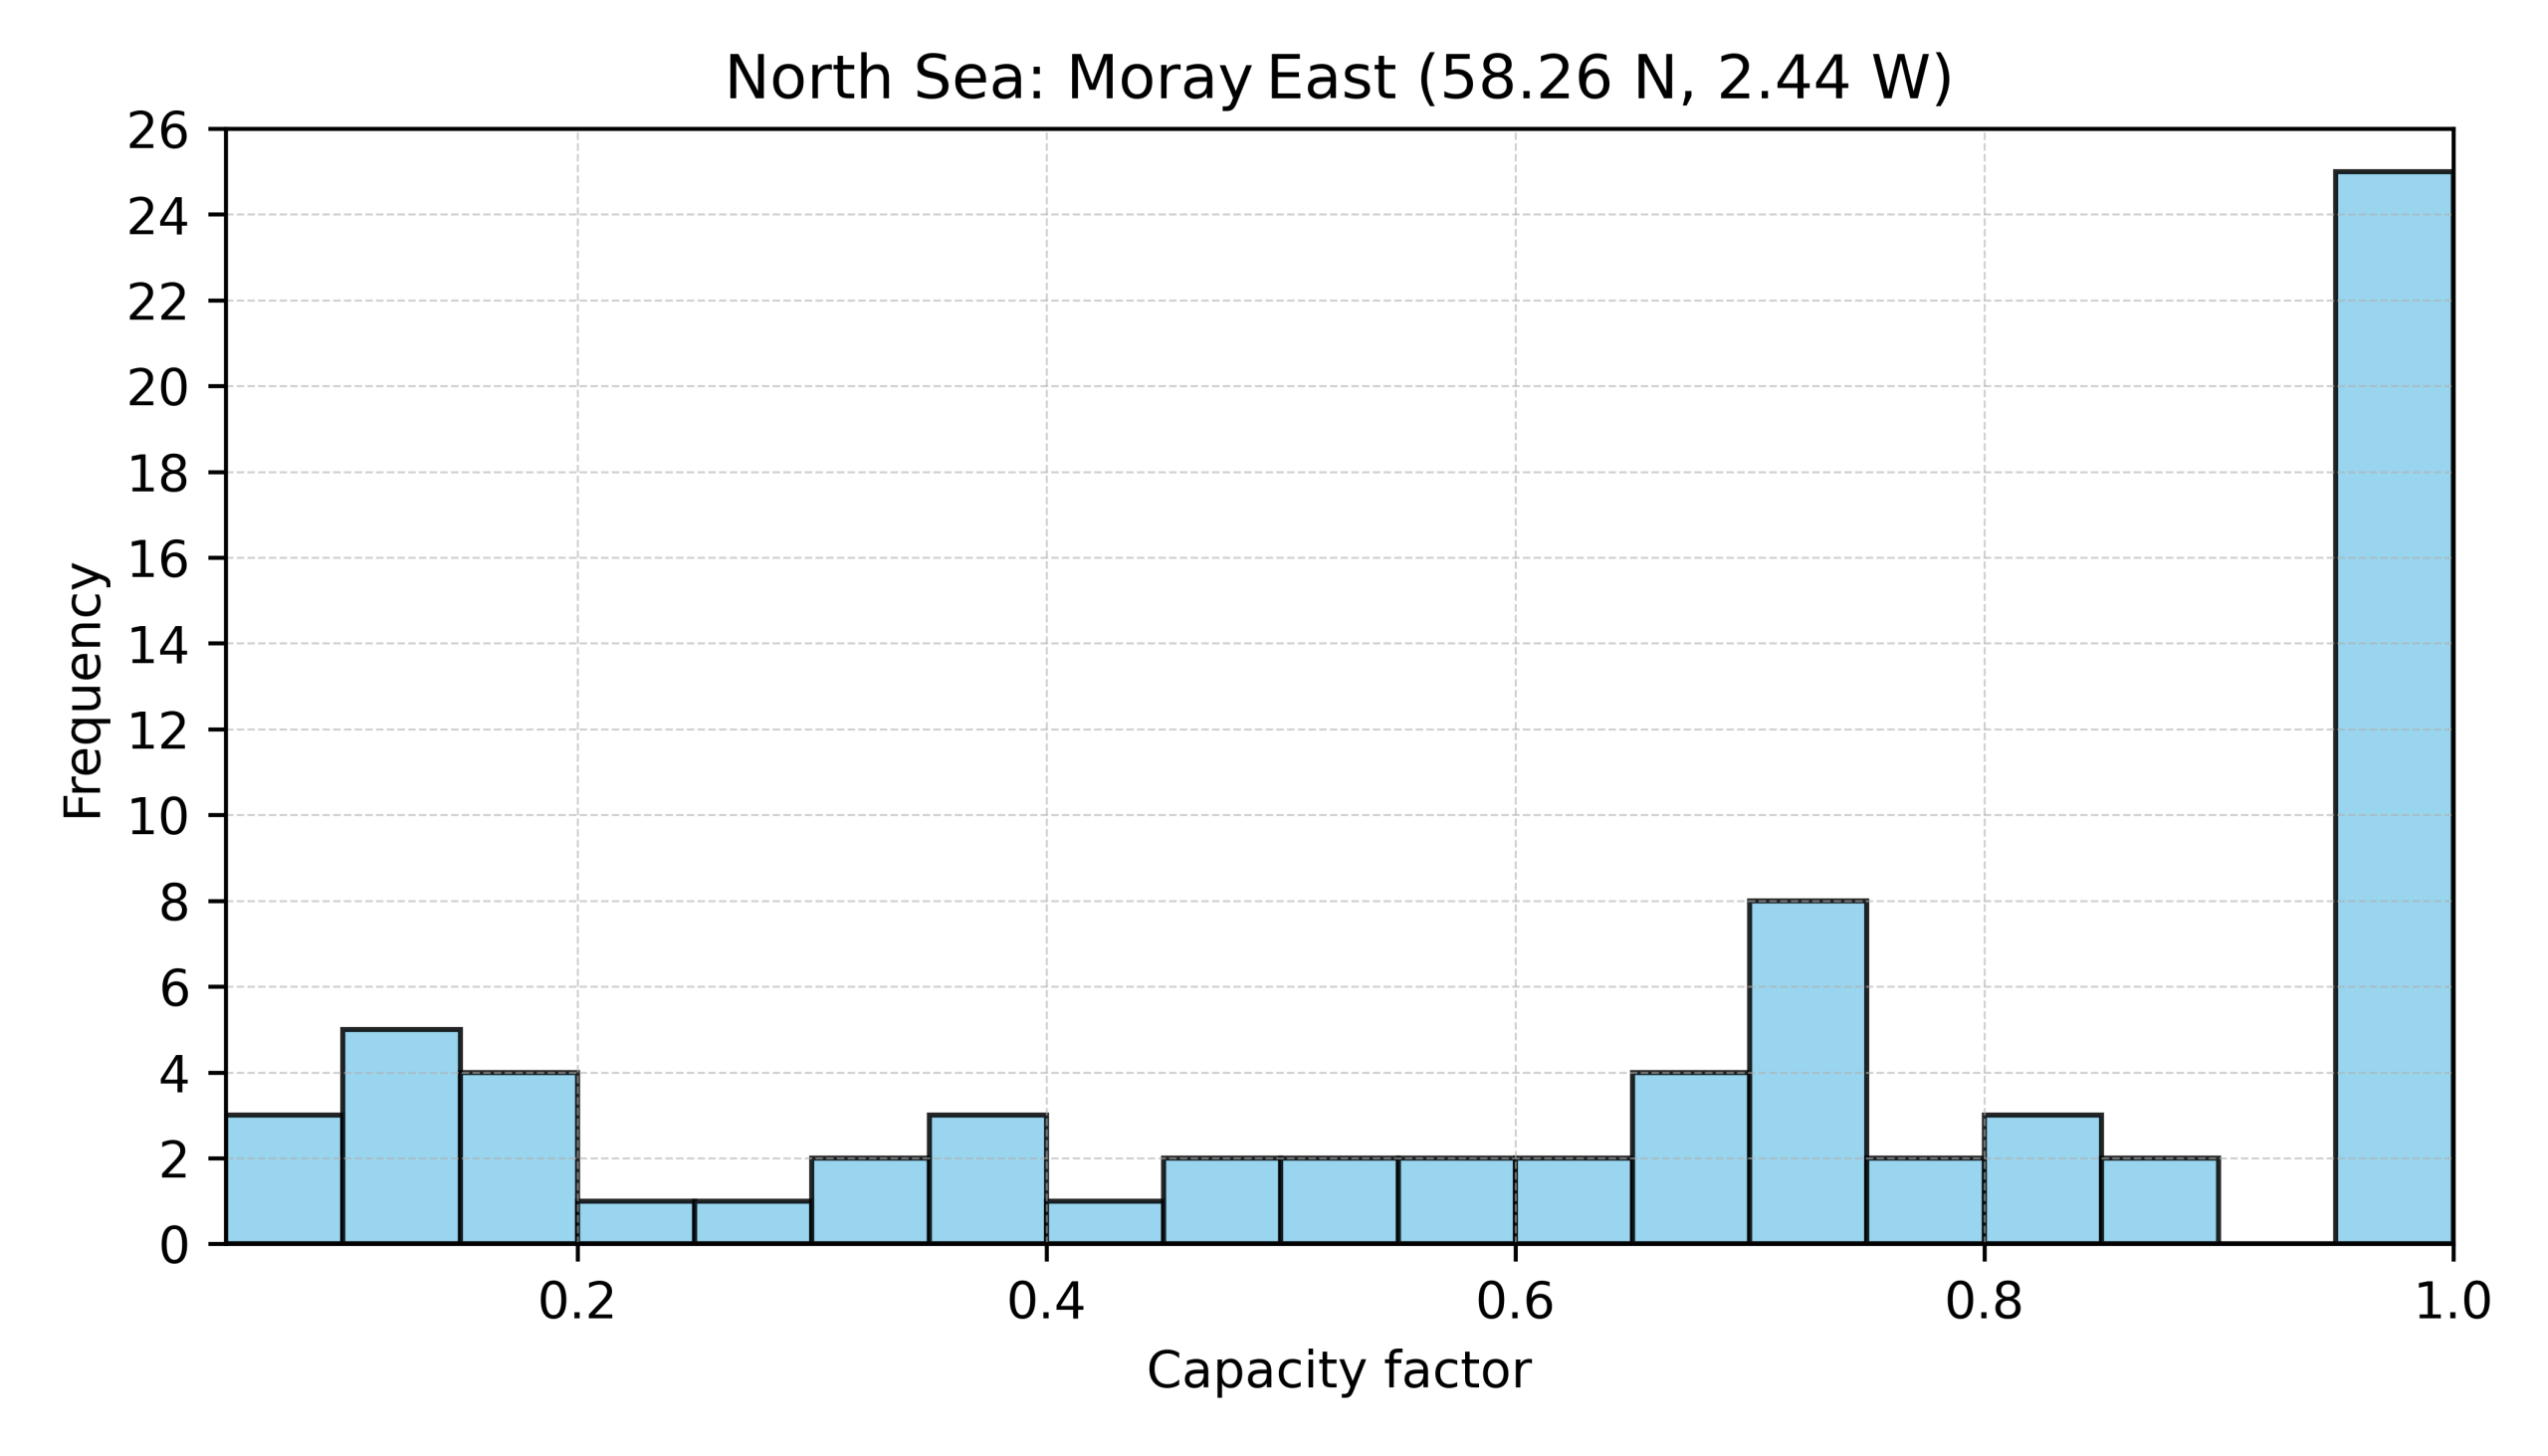
The North Sea is among the most promising regions for wind energy, hosting some of the world’s largest offshore wind farms. For example, a planner assessing wind speed distribution and capacity factors in the Moray East area to evaluate the potential of a given turbine model class (such as the S Vestas V164 used by OceanWinds in their park), can use the Climate DT’s application to obtain this information. The Climate DT system enables the exploration of optimal turbine placement for wind farms, helping maximise energy production and resource efficiency.

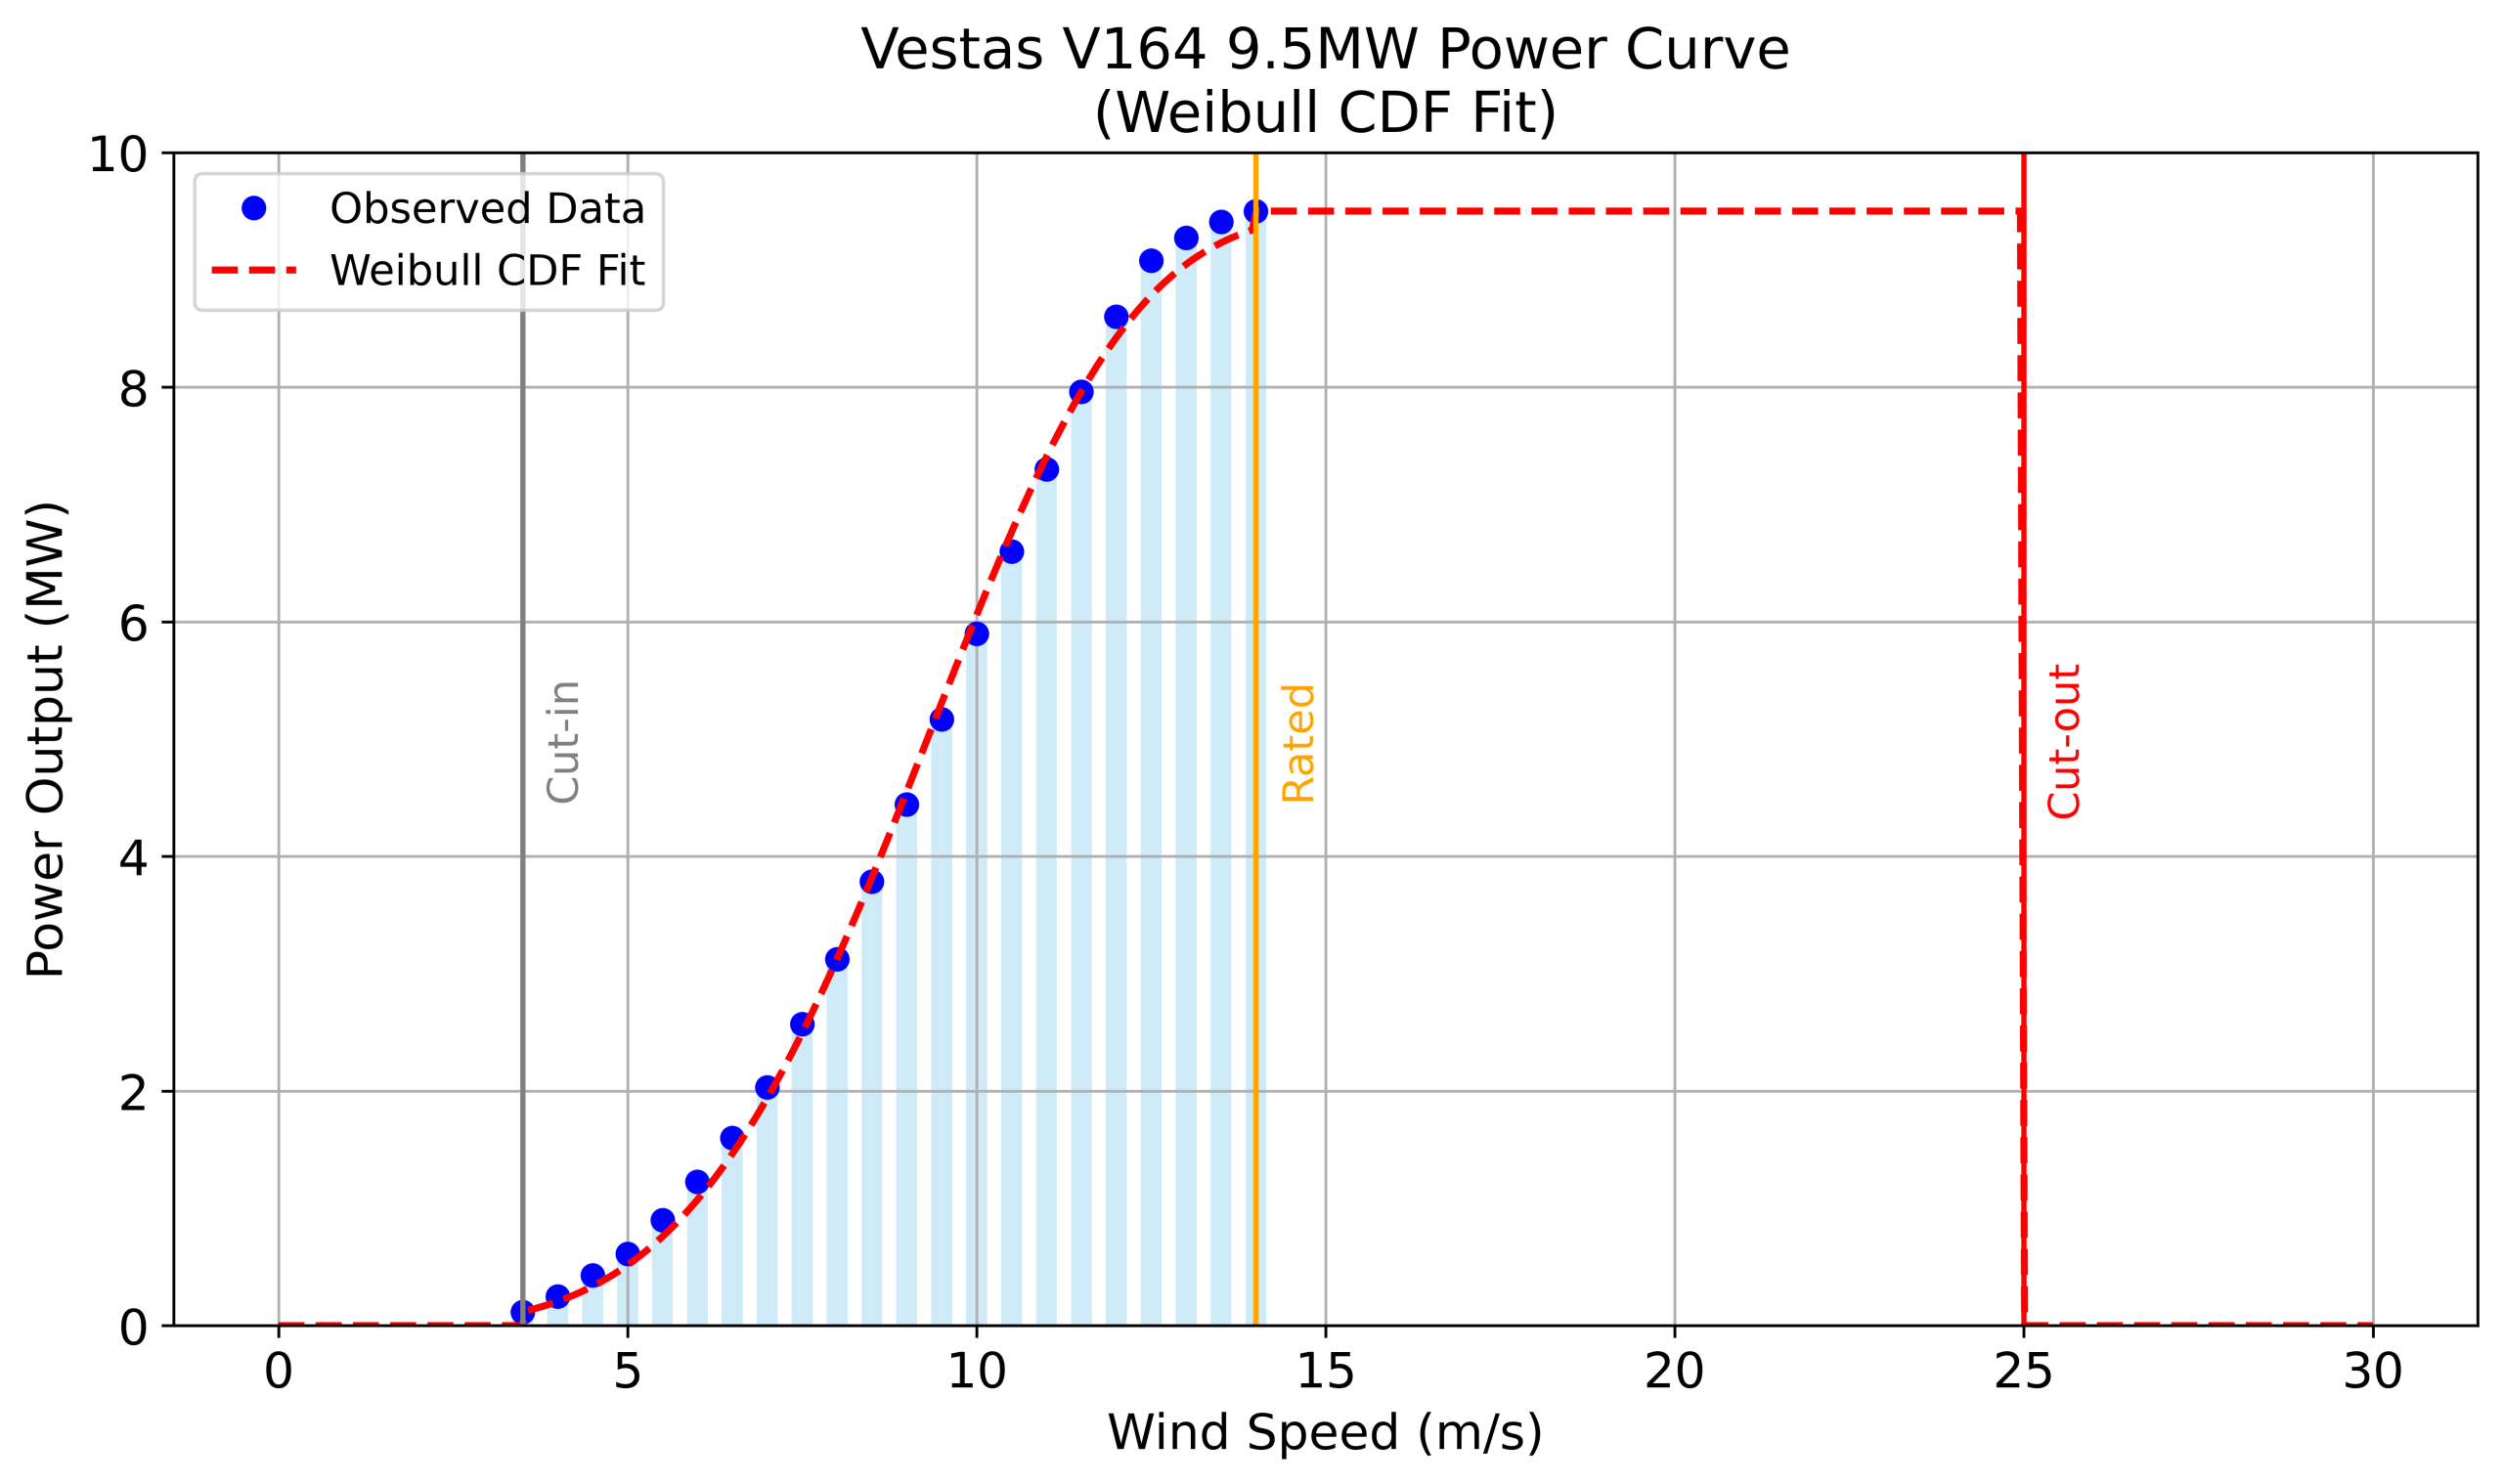
Figure 8. Distribution of Wind Speed (left) and Capacity Factor (middle) over Moray East for class S Vestos V164 wind turbine over one week and computed from 1-hourly wind components (100u, 100v). Manufacturer power curve (relation between wind speed and power) for Vestas V164 wind turbine with Weibull CDF approximation (right).

5. Future outlook

These promising results demonstrate the potential of the Climate DT to deliver tailored, km-scale information for the wind energy sector. The Climate DT will enable the scaling and adaptation of such applications for a wider range of wind farm models, ensuring users can access the specific climate information they require. While this development is still ongoing, wind energy indicators from the Phase 2 simulations will become available on the DestinE Core Service Platform (DESP) over the year.

Supporting long-term climate adaptation

By collaborating closely with users and delivering sector-specific, km-scale climate insights, the Climate DT supports wind energy planners and operators to make better-informed decisions. This will not only improve the reliability and efficiency of wind power but also strengthen long-term climate adaptation, sustainable land and ocean use, and biodiversity protection. In doing so, the Climate DT contributes directly to Europe’s broader goals for climate action and energy security. 

For more information about this Climate DT Energy Use Case, you can contact BSC at energy-destine@bsc.es 

The Climate DT, procured by ECMWF is developed through a contract led by CSC-IT Center forScience and includes Alfred Wegener Institute Helmholtz Centre for Polar and Marine Research (AWI), Barcelona Supercomputing Center (BSC), Max Planck Institute for Meteorology (MPI-M), Institute of Atmospheric Sciences and Climate (CNR-ISAC), German Climate Computing Centre (DKRZ), National Meteorological Service of Germany (DWD), Finnish Meteorological Institute (FMI), Hewlett Packard Enterprise (HPE), Polytechnic University of Turin (POLITO), Catholic University of Louvain (UCL), Helmholtz Centre for Environmental Research (UFZ) and University of Helsinki (UH). 

Destination Earth is a European Union funded initiative launched in 2022, with the aim to build a digital replica of the Earth system by 2030. The initiative is being jointly implemented by three entrusted entities: the European Centre for Medium-Range Weather Forecasts (ECMWF) responsible for the creation of the first two ‘digital twins’ and the ‘Digital Twin Engine’, the European Space Agency (ESA) responsible for building the ‘Core Service Platform’, and the European Organisation for the Exploitation of Meteorological Satellites (EUMETSAT), responsible for the creation of the ‘Data Lake’.

We acknowledge the EuroHPC Joint Undertaking for awarding DestinE  strategic access to the EuroHPC supercomputers LUMI, hosted by CSC (Finland) and the LUMI consortium, Marenostrum5, hosted by BSC (Spain) Leonardo, hosted by Cineca (Italy) and MeluXina, hosted by LuxProvide (Luxembourg) through a EuroHPC Special Access call. 

More information about Destination Earth is on the Destination Earth website and the EU Commission website.

For more information about ECMWF’s role visit ecmwf.int/DestinE