More Resilient City Planning
September 2022 - April 2024
Providing a heat stress index to allow urban planners to have a better understanding of the best adaptation practices against extreme temperatures in urban environments.
This use case ran from September 2022 – April 2024 and is now closed.
In a nutshell
- Heat stress in urban areas has detrimental effects on the public health and urban infrastructure and it is constantly amplified by the climate change.
- With the capabilities of Climate DT, this use case aimed to develop advanced simulations that would help to address the challenges caused by the urban heat islands.
- The use case produced a heat stress index obtained from several indicators as well as from existing specific heat stress indicators, which supports better decision-making and data-driven adaptation policies in cities.
Technical Overview
- Use Case Topic: Urban Heat
- Scale of the Use Case: Regional
- Policy addressed: Climate adaptation
- Providers: CSC-IT Center for Science
Challenge
An urban heat island is a metropolitan area that experiences significantly warmer temperatures than the rural areas surrounding it. The causes of the drastic change in temperature often depends on human activities and climate change, which acts as an amplifier. Not only urban heat has a negative impact on public health, but it also endangers the natural ecosystem and increases the energy consumption in cities.
With this use case the capabilities of the Climate DT were used to address the pressing issue of heat stress in urban areas, where 75% of the European population currently lives. Heatwaves are possibly the extreme weather event with the biggest and most direct impacts on human wellbeing, and with climate change are predicted to be more severe and frequent and longer.
DestinE Solution
The heat island effect multiplies the consequences of extreme temperatures and with the better simulations of the global circulation systems included in the Climate DT we can improve our understanding of the expected evolution of heat islands under climate change conditions, to apply more effective adaptation measures.
Impact
Through this use case the Climate DT provided a heat stress index obtained from several indicators as well as from existing specific heat stress indicators, commuted using the Thermofeel library, developed by ECMWF. The application was coupled with a machine learning downscaling model developed by Portugal’s +ATLANTIC.
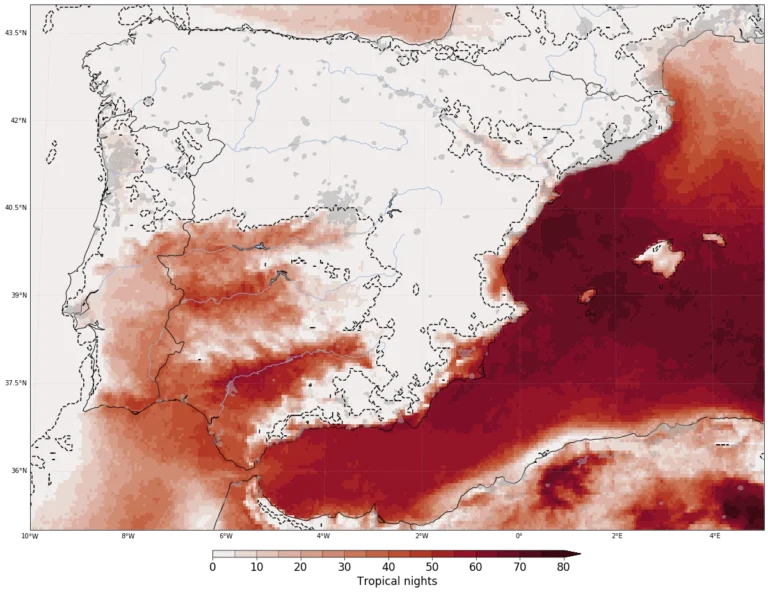
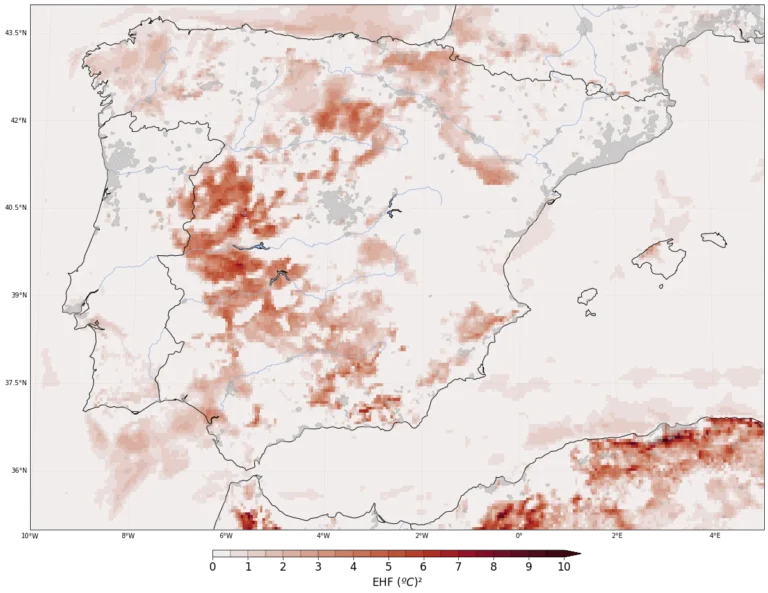
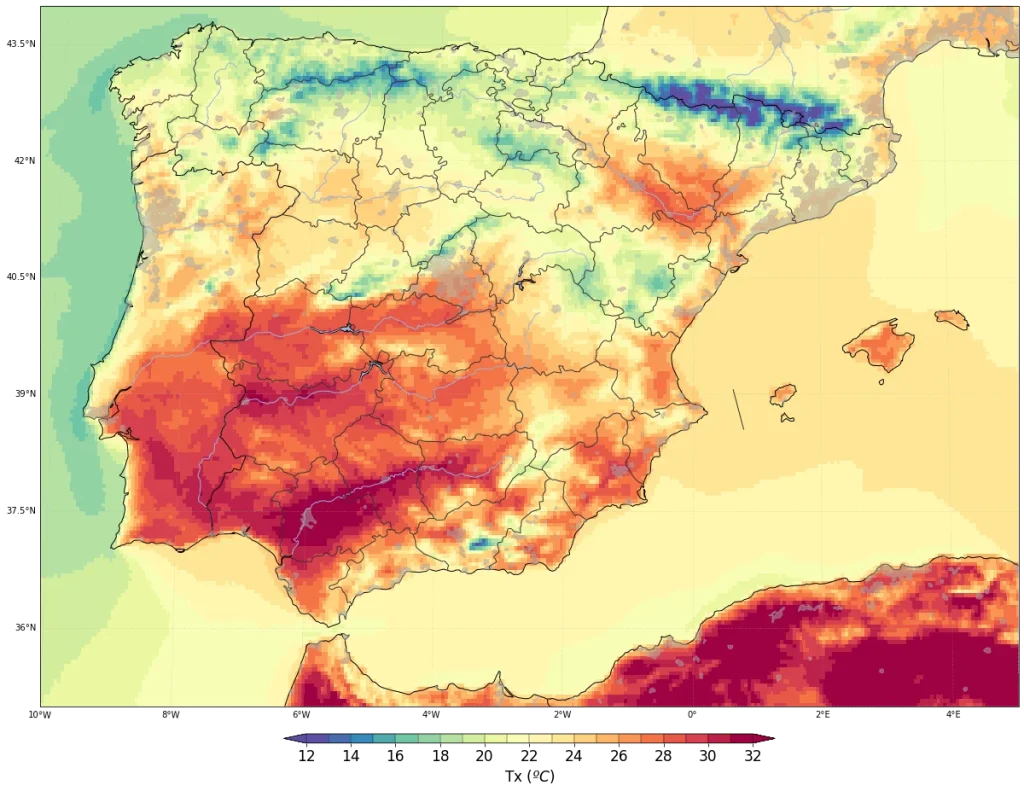
The application produced a set of temperature extreme indicators such as tropical nights, warm nights, summer days, warm days, absolute maximum temperature, excess heat factor and heat wave magnitude index, to name a few, and thermal comfort indicators like cooling degree days, NOAA Heat Index, wet bulb globe temperature and Universal Thermal Climate Index, at several spatial and temporal scales.
Initially the use case was demonstrated for selected cities across the 5 continents. Thanks to the +ATLANTIC machine learning processing, the Urban application downscaled the information about heat island effect at around 100-200m spatial resolution.
The urban use case allowed urban planners (architects, civil engineers, decision makers…) to interact with the simulations for a better understanding of the best adaptation practices against extreme temperatures in urban environments.
